
Poster Session B
Systemic lupus erythematosus (SLE)
Kevin Thomas, BSc
Oklahoma Medical Research Foundation
Oklahoma City, OK, United States
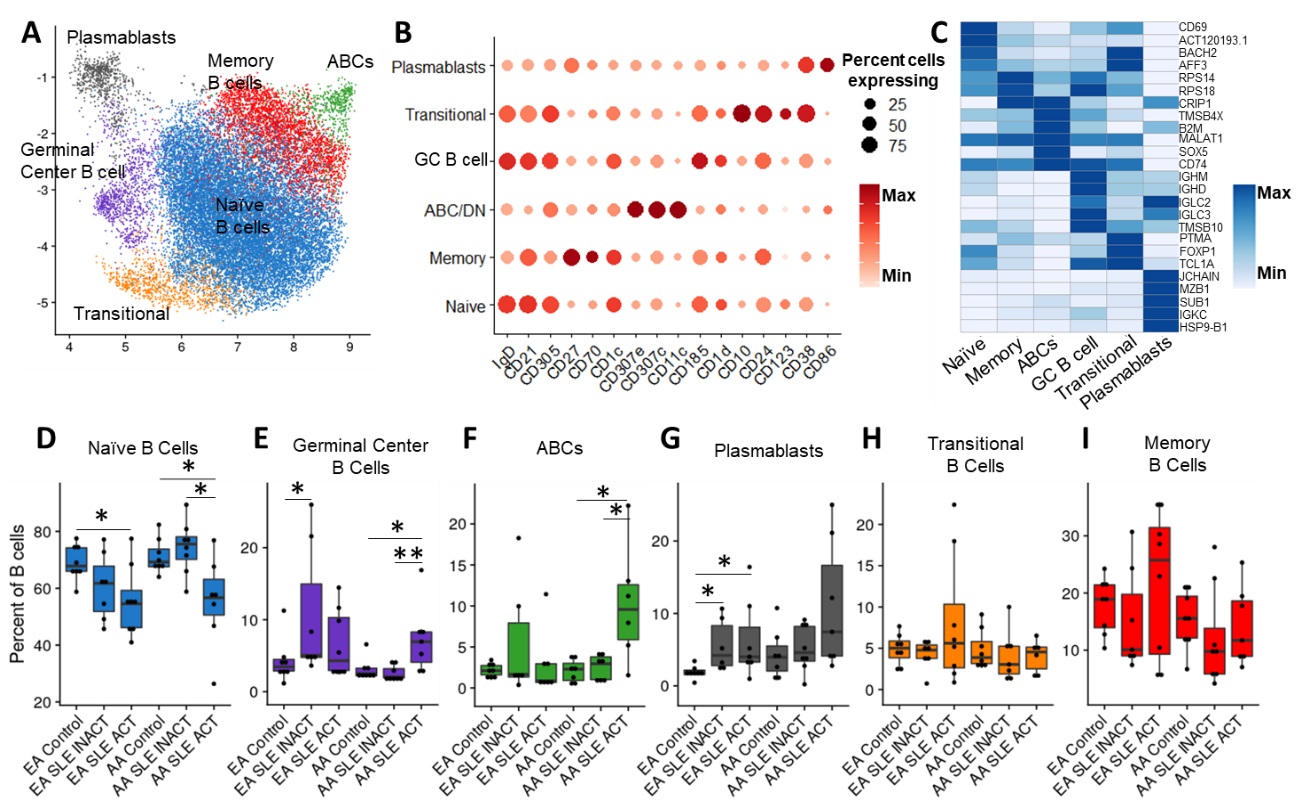 Figure 1. B cell compartments are differentially altered in SLE depending on both ancestry and disease activity. (A) Uniform Manifold Approximation and Projection (UMAP) of weighted nearest neighbor (WNN) integration of B cell CITE-seq data. Clusters determined by Leiden clustering on the WNN graph were defined by expression of marker surface proteins (B) and marker genes (C). Dot plots of the proportion of total B cells for each patient group consisting of Naïve B cells (D), GC B cells (E), ABCs (F), Plasmablasts (G), Transitional B cells (H), and Memory B cells (I). Comparisons were performed by Mann-Whitney test with Benjamini-Hochberg correction for multiple comparisons. *p < 0.05, and **p < 0.01.
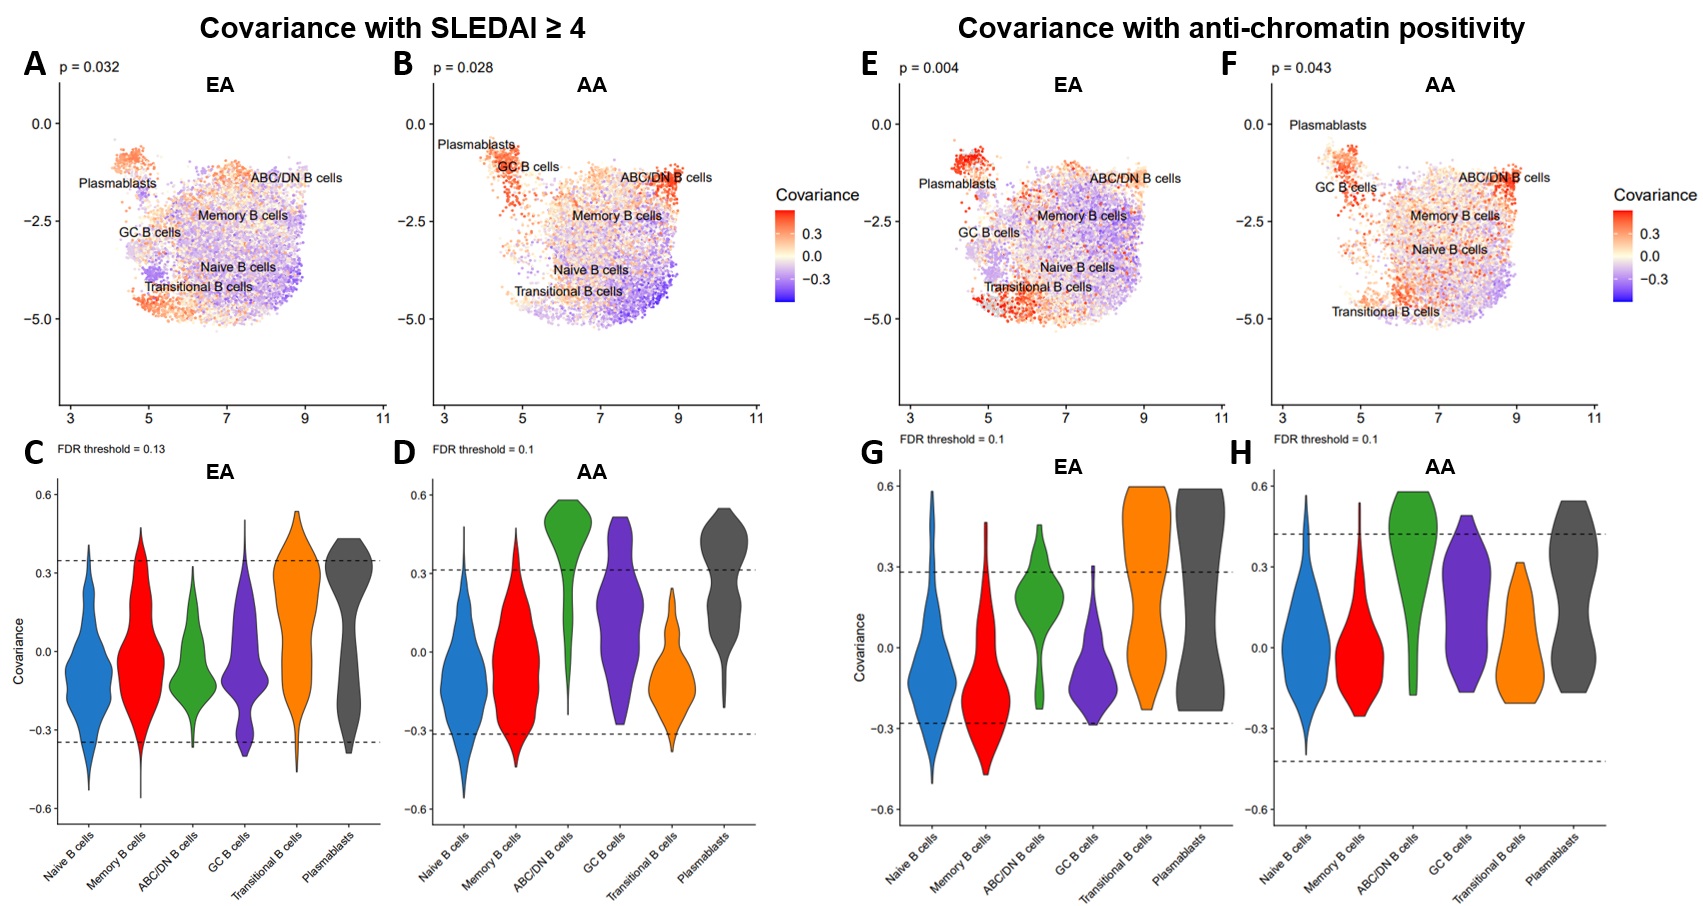 Figure 2. B cell populations linked to disease activity in EA and AA are associated with autoantibody positivity. UMAP colored by covariance of single-cell neighborhoods with active SLE from independent analyses of EA (A) and AA (B) cells. Violin plots of active SLE covariance of single-cell neighborhoods within each of the six identified clusters in EA (C) and AA (D) cells. UMAP colored by covariance of single-cell neighborhoods with anti-chromatin positivity from independent analyses of EA (E) and AA (F) cells. Violin plots of anti-chromatin covariance of single-cell neighborhoods within each of the six identified clusters in EA (C) and AA (D) cells. P-values represent the significance of the overall covariance of B cell neighborhoods with the variable of interest. Dashed lines represent the indicated false discovery rate (FDR) threshold, beyond which neighborhood correlations are considered statistically significant.
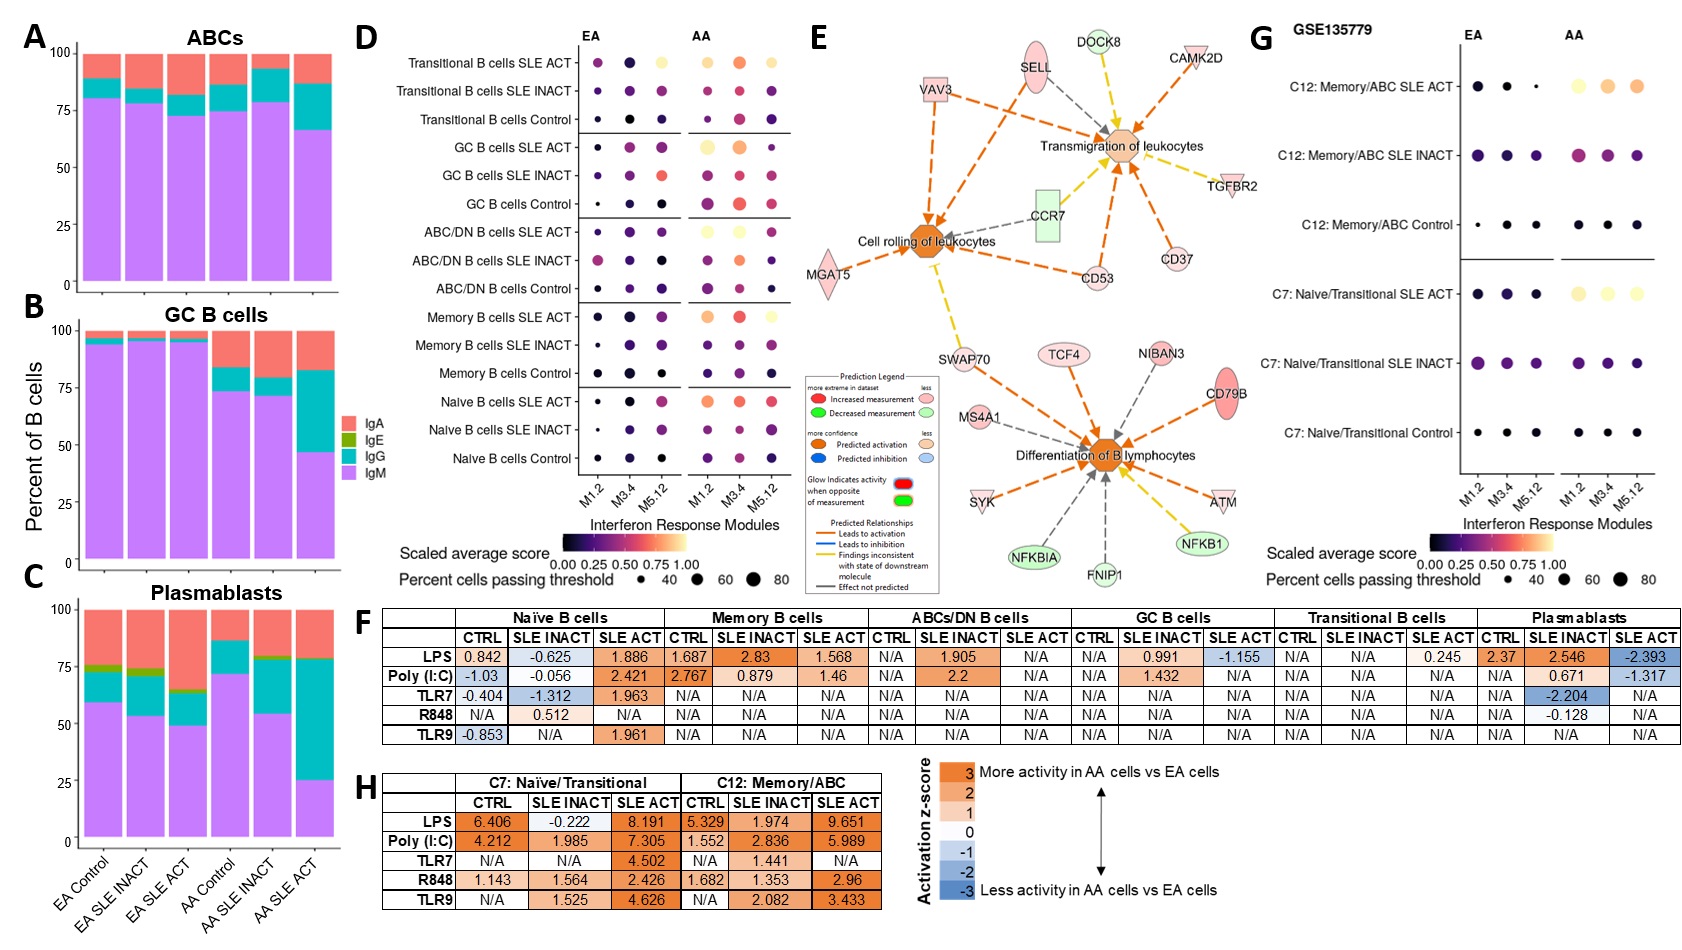 Figure 3. Transcriptomic analyses reveal unique perturbations of B cell populations in AA active SLE. Percentage of B cells with highest gene expression of Ig classes IgA, IgE, IgG or IgM in ABCs (A), GC B cells (B), and Plasmablasts (C). (D) Dot plot of gene expression for specific IFN response modules in each B cell subset and disease group. (E) Ingenuity pathway analysis (IPA) of differentially expressed genes (DEGs) in Naïve B cells between all active SLE and controls shows predicted activity of differentiation and migration pathways. (F) IPA of DEGs in B cell subsets between AA and EA cells in disease groups shows downstream activity of TLR and their ligands. Independent analysis of published single-cell RNA-seq data in SLE (GSE135779) showed similar patterns of IFN response (G) and downstream TLR activity (H) as our data.