
Poster Session B
Systemic lupus erythematosus (SLE)
Kathryn Kingsmore Allison, PhD
AMPEL BioSolutions
Charlottesville, VA, United States
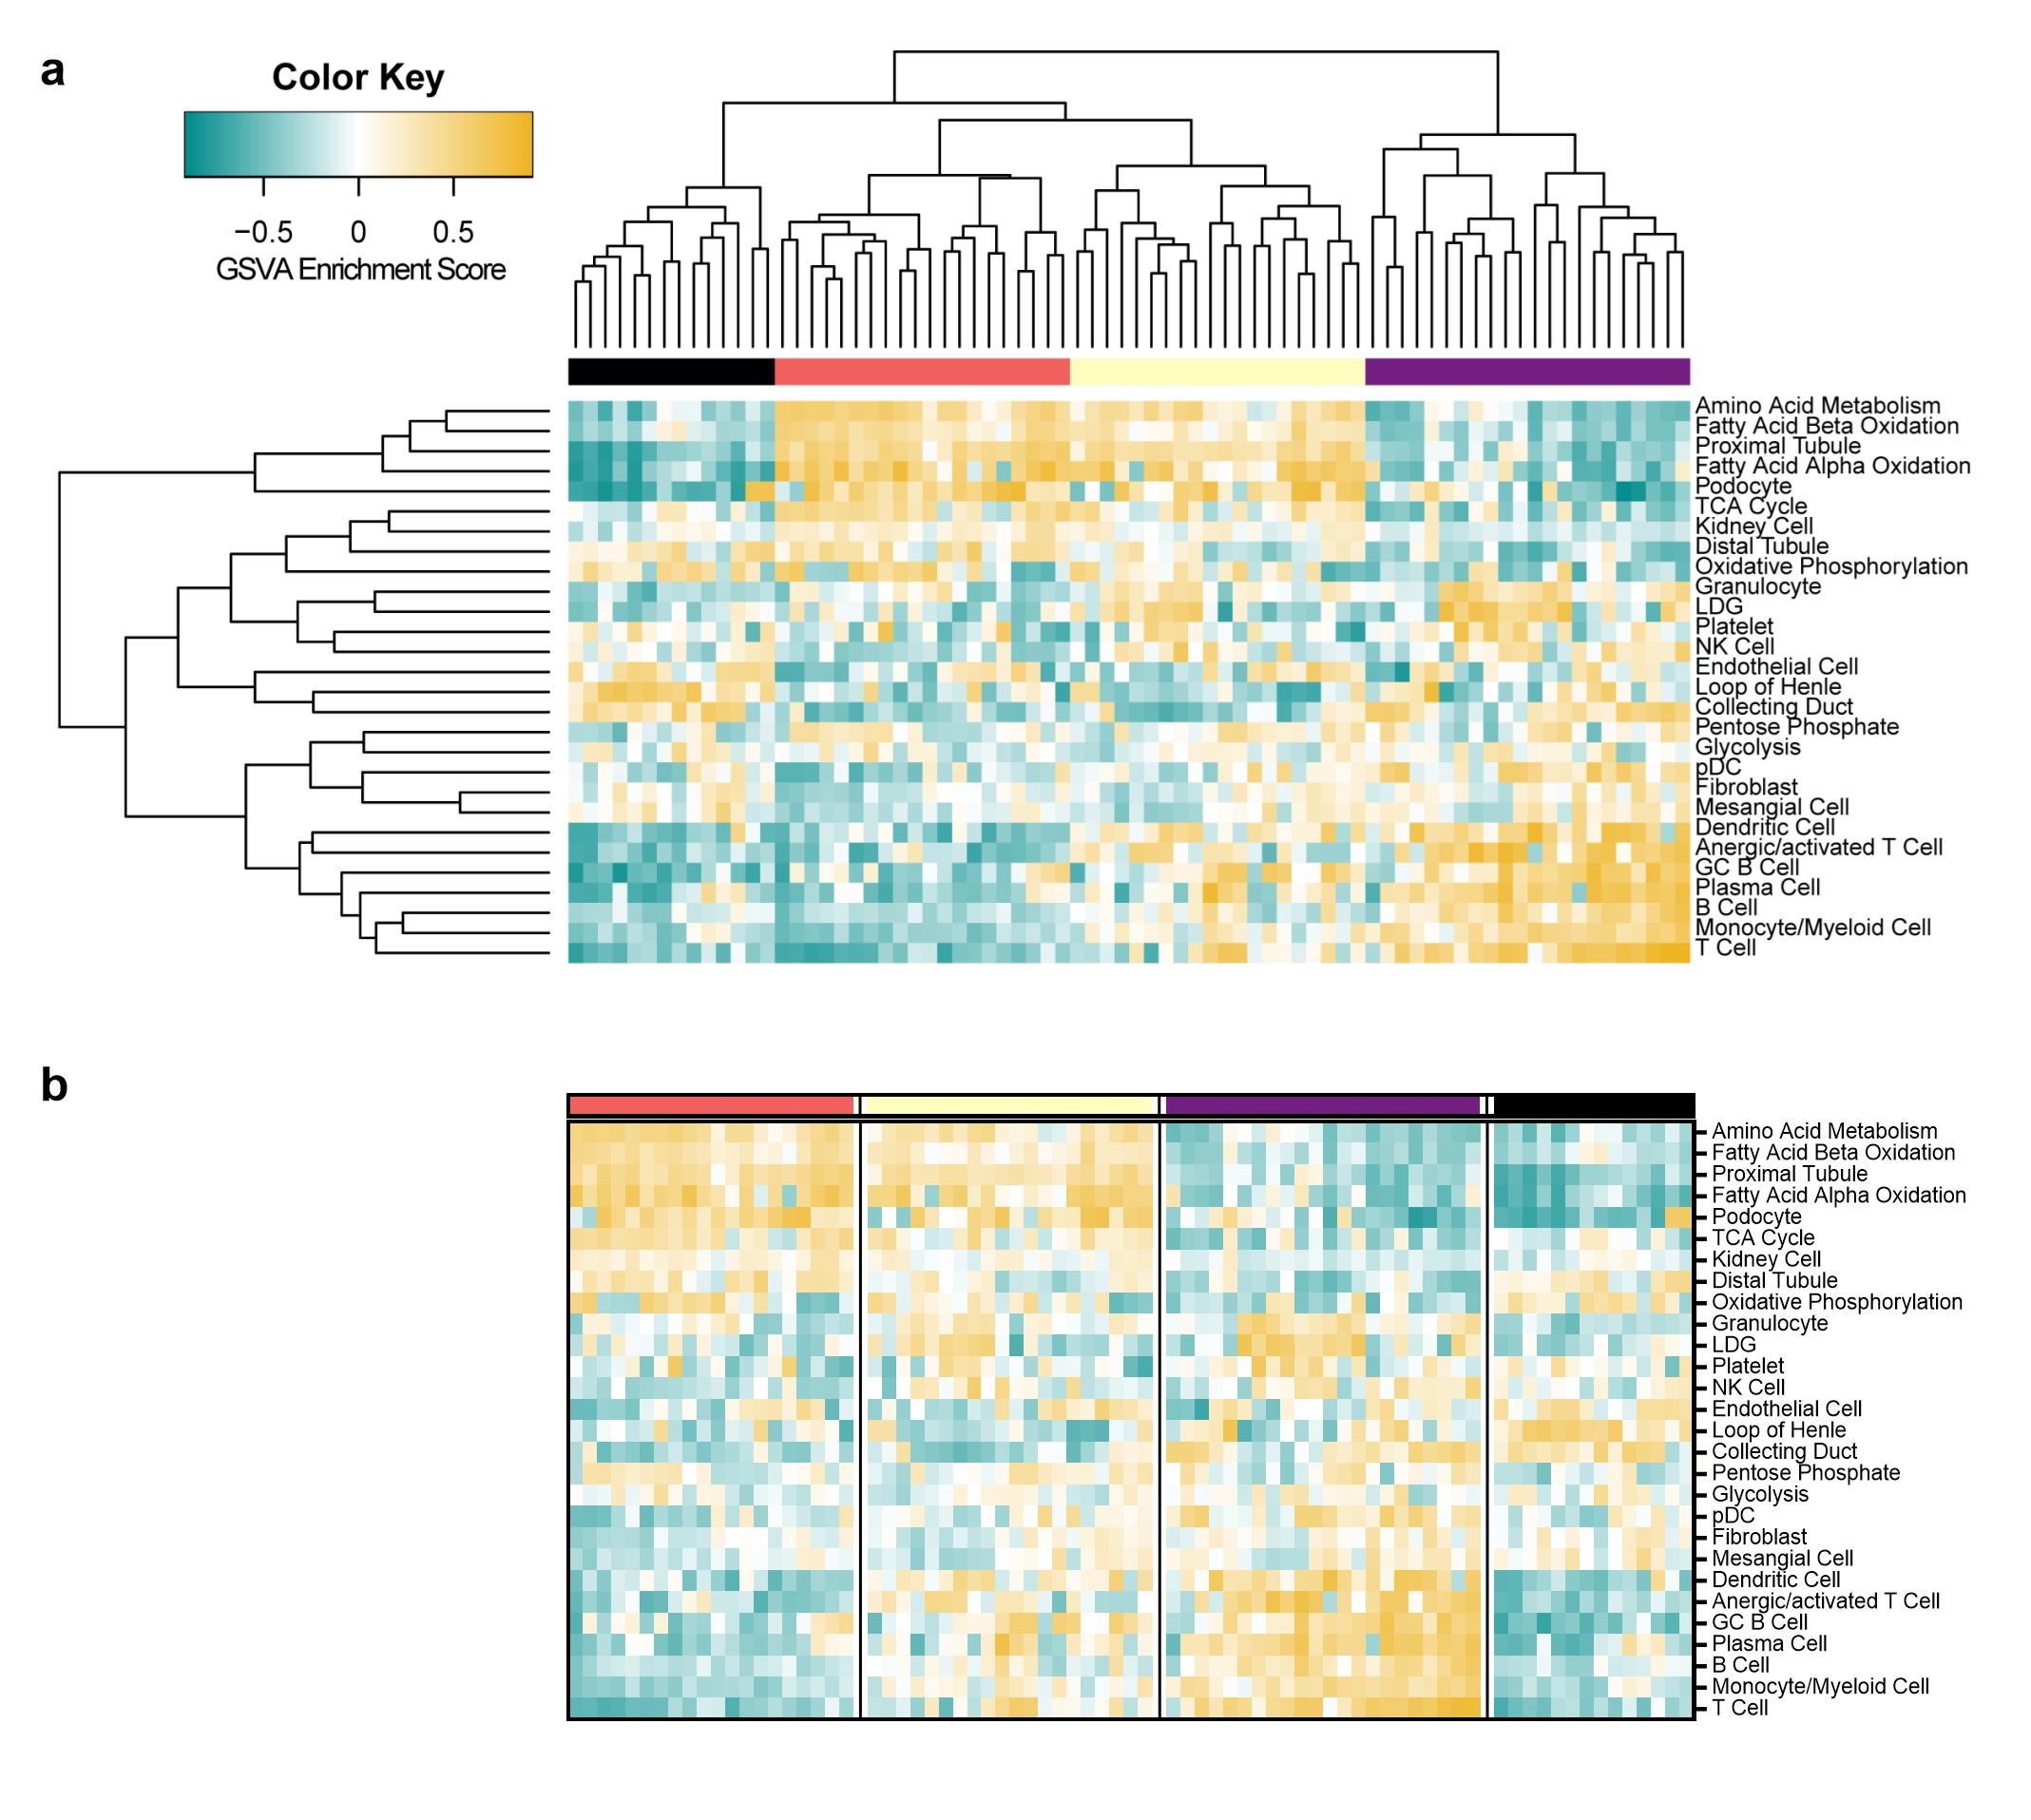 Figure 1 | Clustering of GSVA enrichment scores in lupus kidneys reveals four distinct endotypes of patients with LN. (a) Row and column hierarchical clustering of 76 patients with LN into four groups based upon gene expression of cellular and pathway gene modules. (b) Reordered clustering of LN patients in order of molecular disease severity from least to greatest. The columns represent individual patients that are grouped into four clusters (black, coral, yellow, and purple). The rows represent gene modules indicative of immune/inflammatory cells, non-hematopoietic cells, and cellular metabolism.
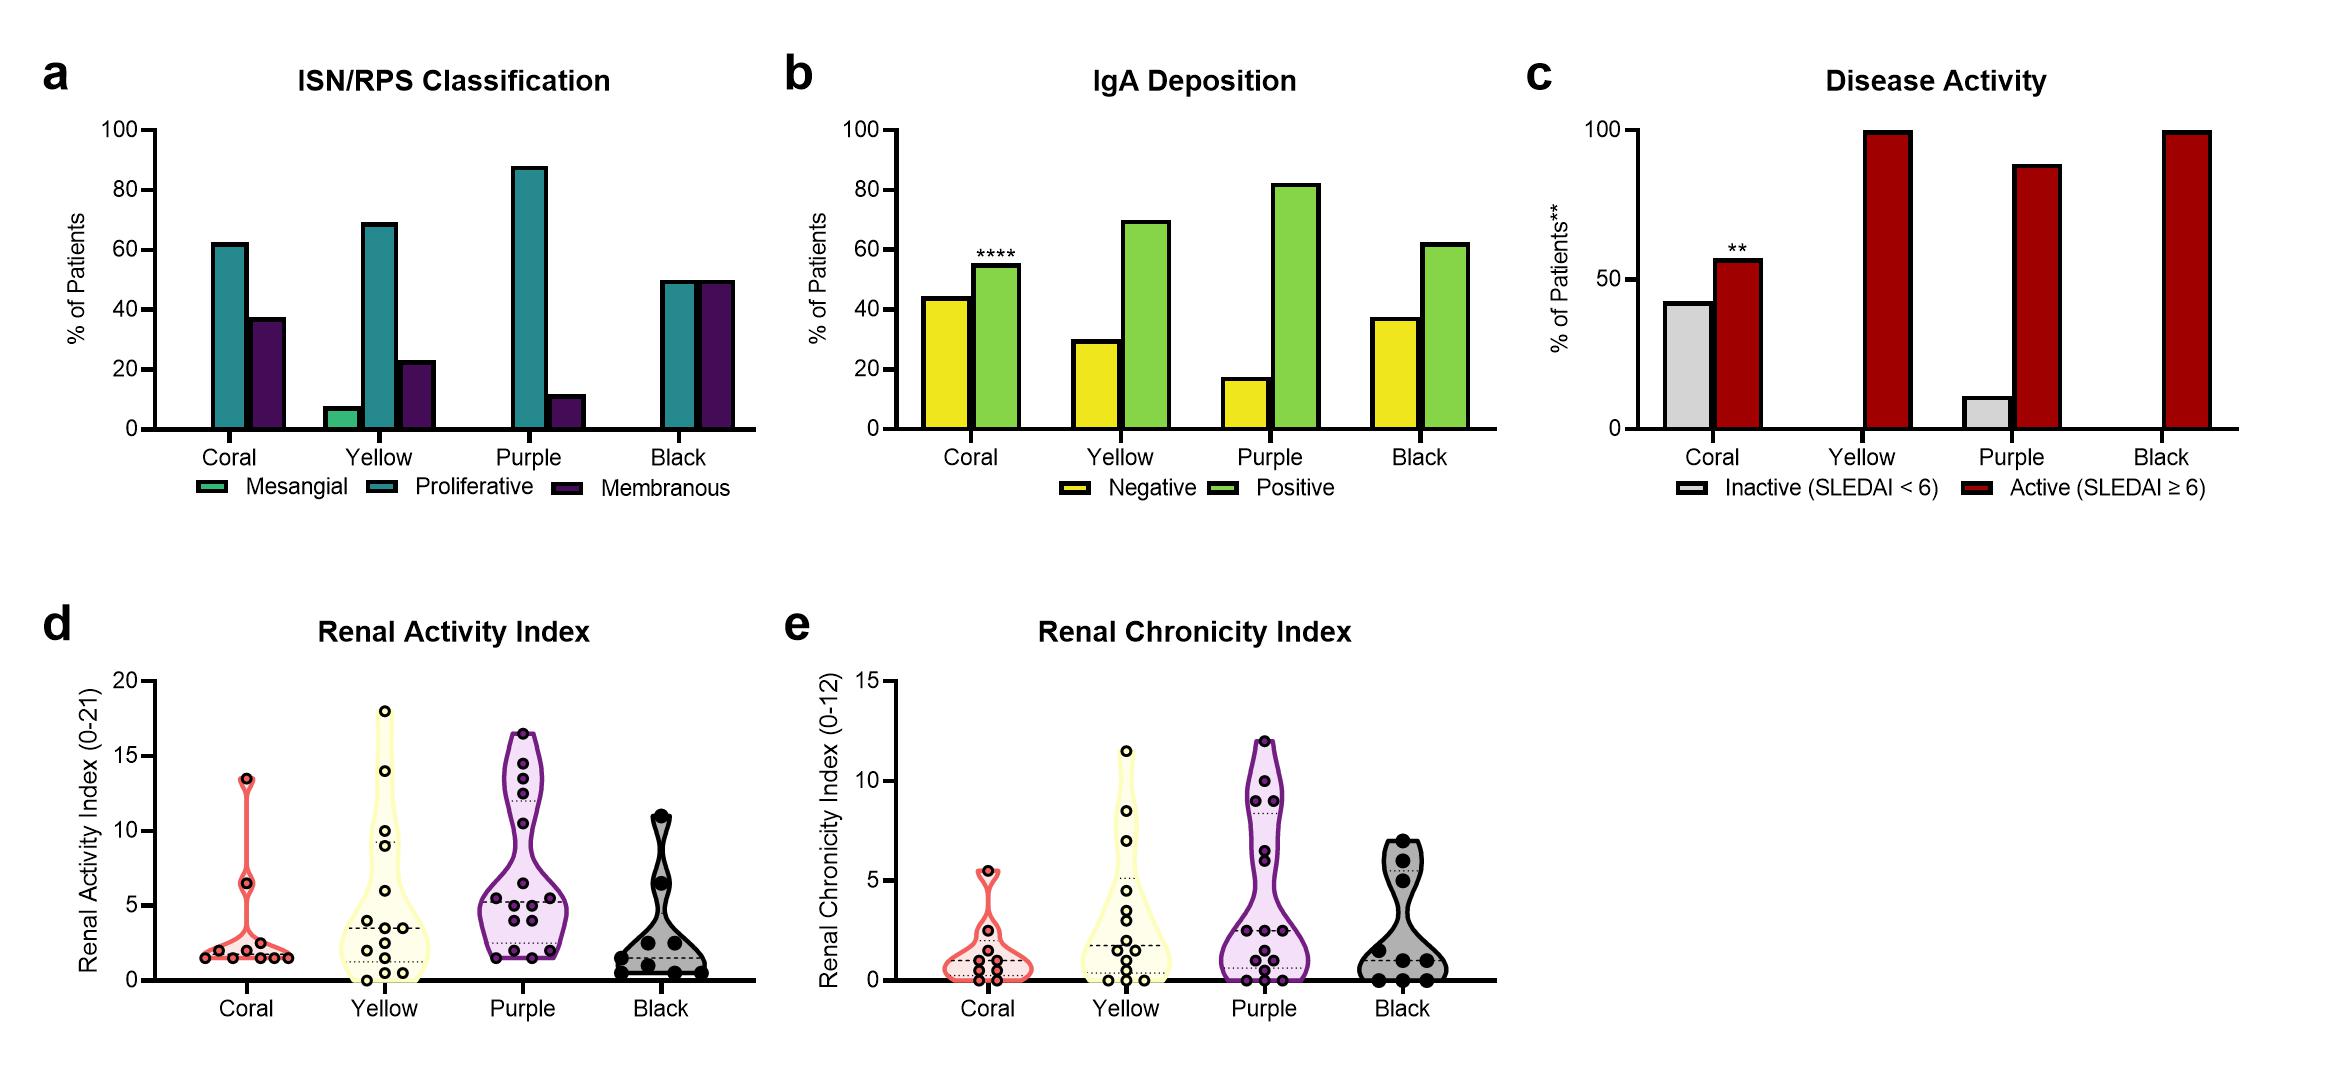 Figure 2 | Comparison of molecular endotypes with clinical features reveals some correlation between gene expression and histology. Distribution of (a) ISN/RPS classes in 46 patients with LN, (b) positive or negative IgA deposition in 44 patients with LN, (c) inactive or active SLEDAI in 32 patients with LN, (d) renal activity index in 49 patients with LN, and (e) renal chronicity index in 48 patients with LN among the LN endotypes. In (a-c) significant differences in expected and observed frequencies between coral, the “least abnormal” LN endotype, and all other clusters (denoted with asterisk above bars) for (a) proliferative LN, (b) positive IgA deposition, and (c) active SLEDAI were identified by Chi Square Test. The likelihood of having proliferative LN in the coral cluster was not significantly different than the other clusters. The likelihood (odds ratio) of having positive IgA deposition in the coral cluster is 0.43 (p < 0.0001) as compared to the other three clusters. The likelihood (odds ratio) of having active SLE (SLEDAI ≥ 6) in the coral cluster is 0.06 (p < 0.01) as compared to the other three clusters. In (a-c) significant associations between the categorical variables and all clusters (denoted with asterisks on the y-axis) were identified using Chi Square Test of Independence. In (d-e) Significant differences in mean of the renal activity or renal chronicity index between the coral cluster and each other cluster was assessed by Brown-Forsythe and Welch ANOVA with Dunnett’s T3 multiple comparisons. **, p < 0.01, ****, p < 0.0001.