
Poster Session C
Epidemiology, health policy and outcomes
.png "David Leverenz, MD photo")
David Leverenz, MD
Duke University
Durham, NC, United States
 Figure 1: Predictive model Receiver Operating Characteristic (ROC), showing model Area Under the Curve (AUC) and the sensitivity / specificity at the operational point, as compared to current practice without the model.
 Table 1: Clinical and visit-related variables contributing to predictive model performance. Positive coefficients indicate higher log odds of a visit being appropriate for telehealth, and negative coefficients indicate a lower log odds. (*) indicates significant contributors at p < 0.05. DMARD = disease modifying anti-rheumatic drug, cs = conventional synthetic, b = biologic, ts = targeted synthetic.
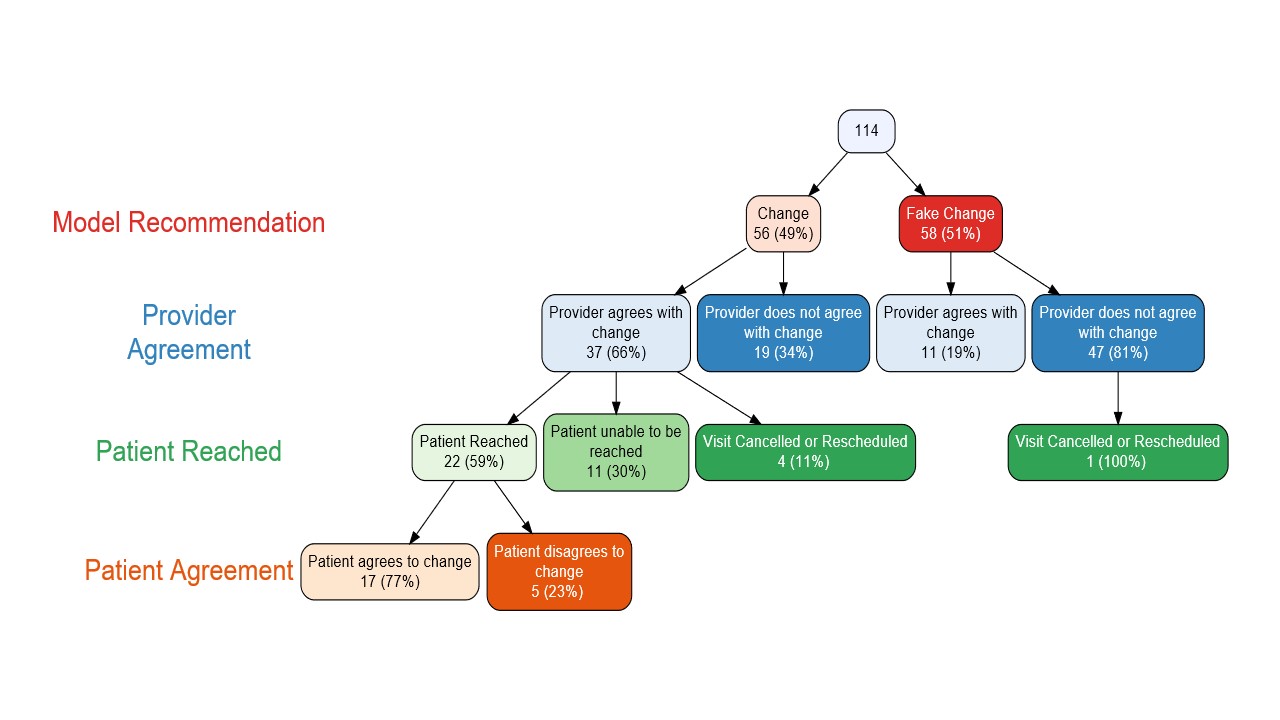 Figure 2: Flowchart of pilot implementation among 3 providers, showing provider agreement with true versus fake model recommendations, as well as patient acceptance of those changes. Patients were not offered a change if the original prediction was a fake prediction.