
Abstract Session
Rheumatoid arthritis (RA)
Satoshi Kubo, MD, PhD
Department of Molecular Targeted Therapies (DMTT), University of Occupational and Environmental Health, Japan
Kitakyushu, Japan
.jpg) Figure 1. Sankey diagram describing proportion of patients per CDAI disease activity category over time. (A) Tofacitinib discontinuation arm (n=56). (B) Methotrexate discontinuation arm (n=57). Data are n (%).
Figure 1. Sankey diagram describing proportion of patients per CDAI disease activity category over time. (A) Tofacitinib discontinuation arm (n=56). (B) Methotrexate discontinuation arm (n=57). Data are n (%). 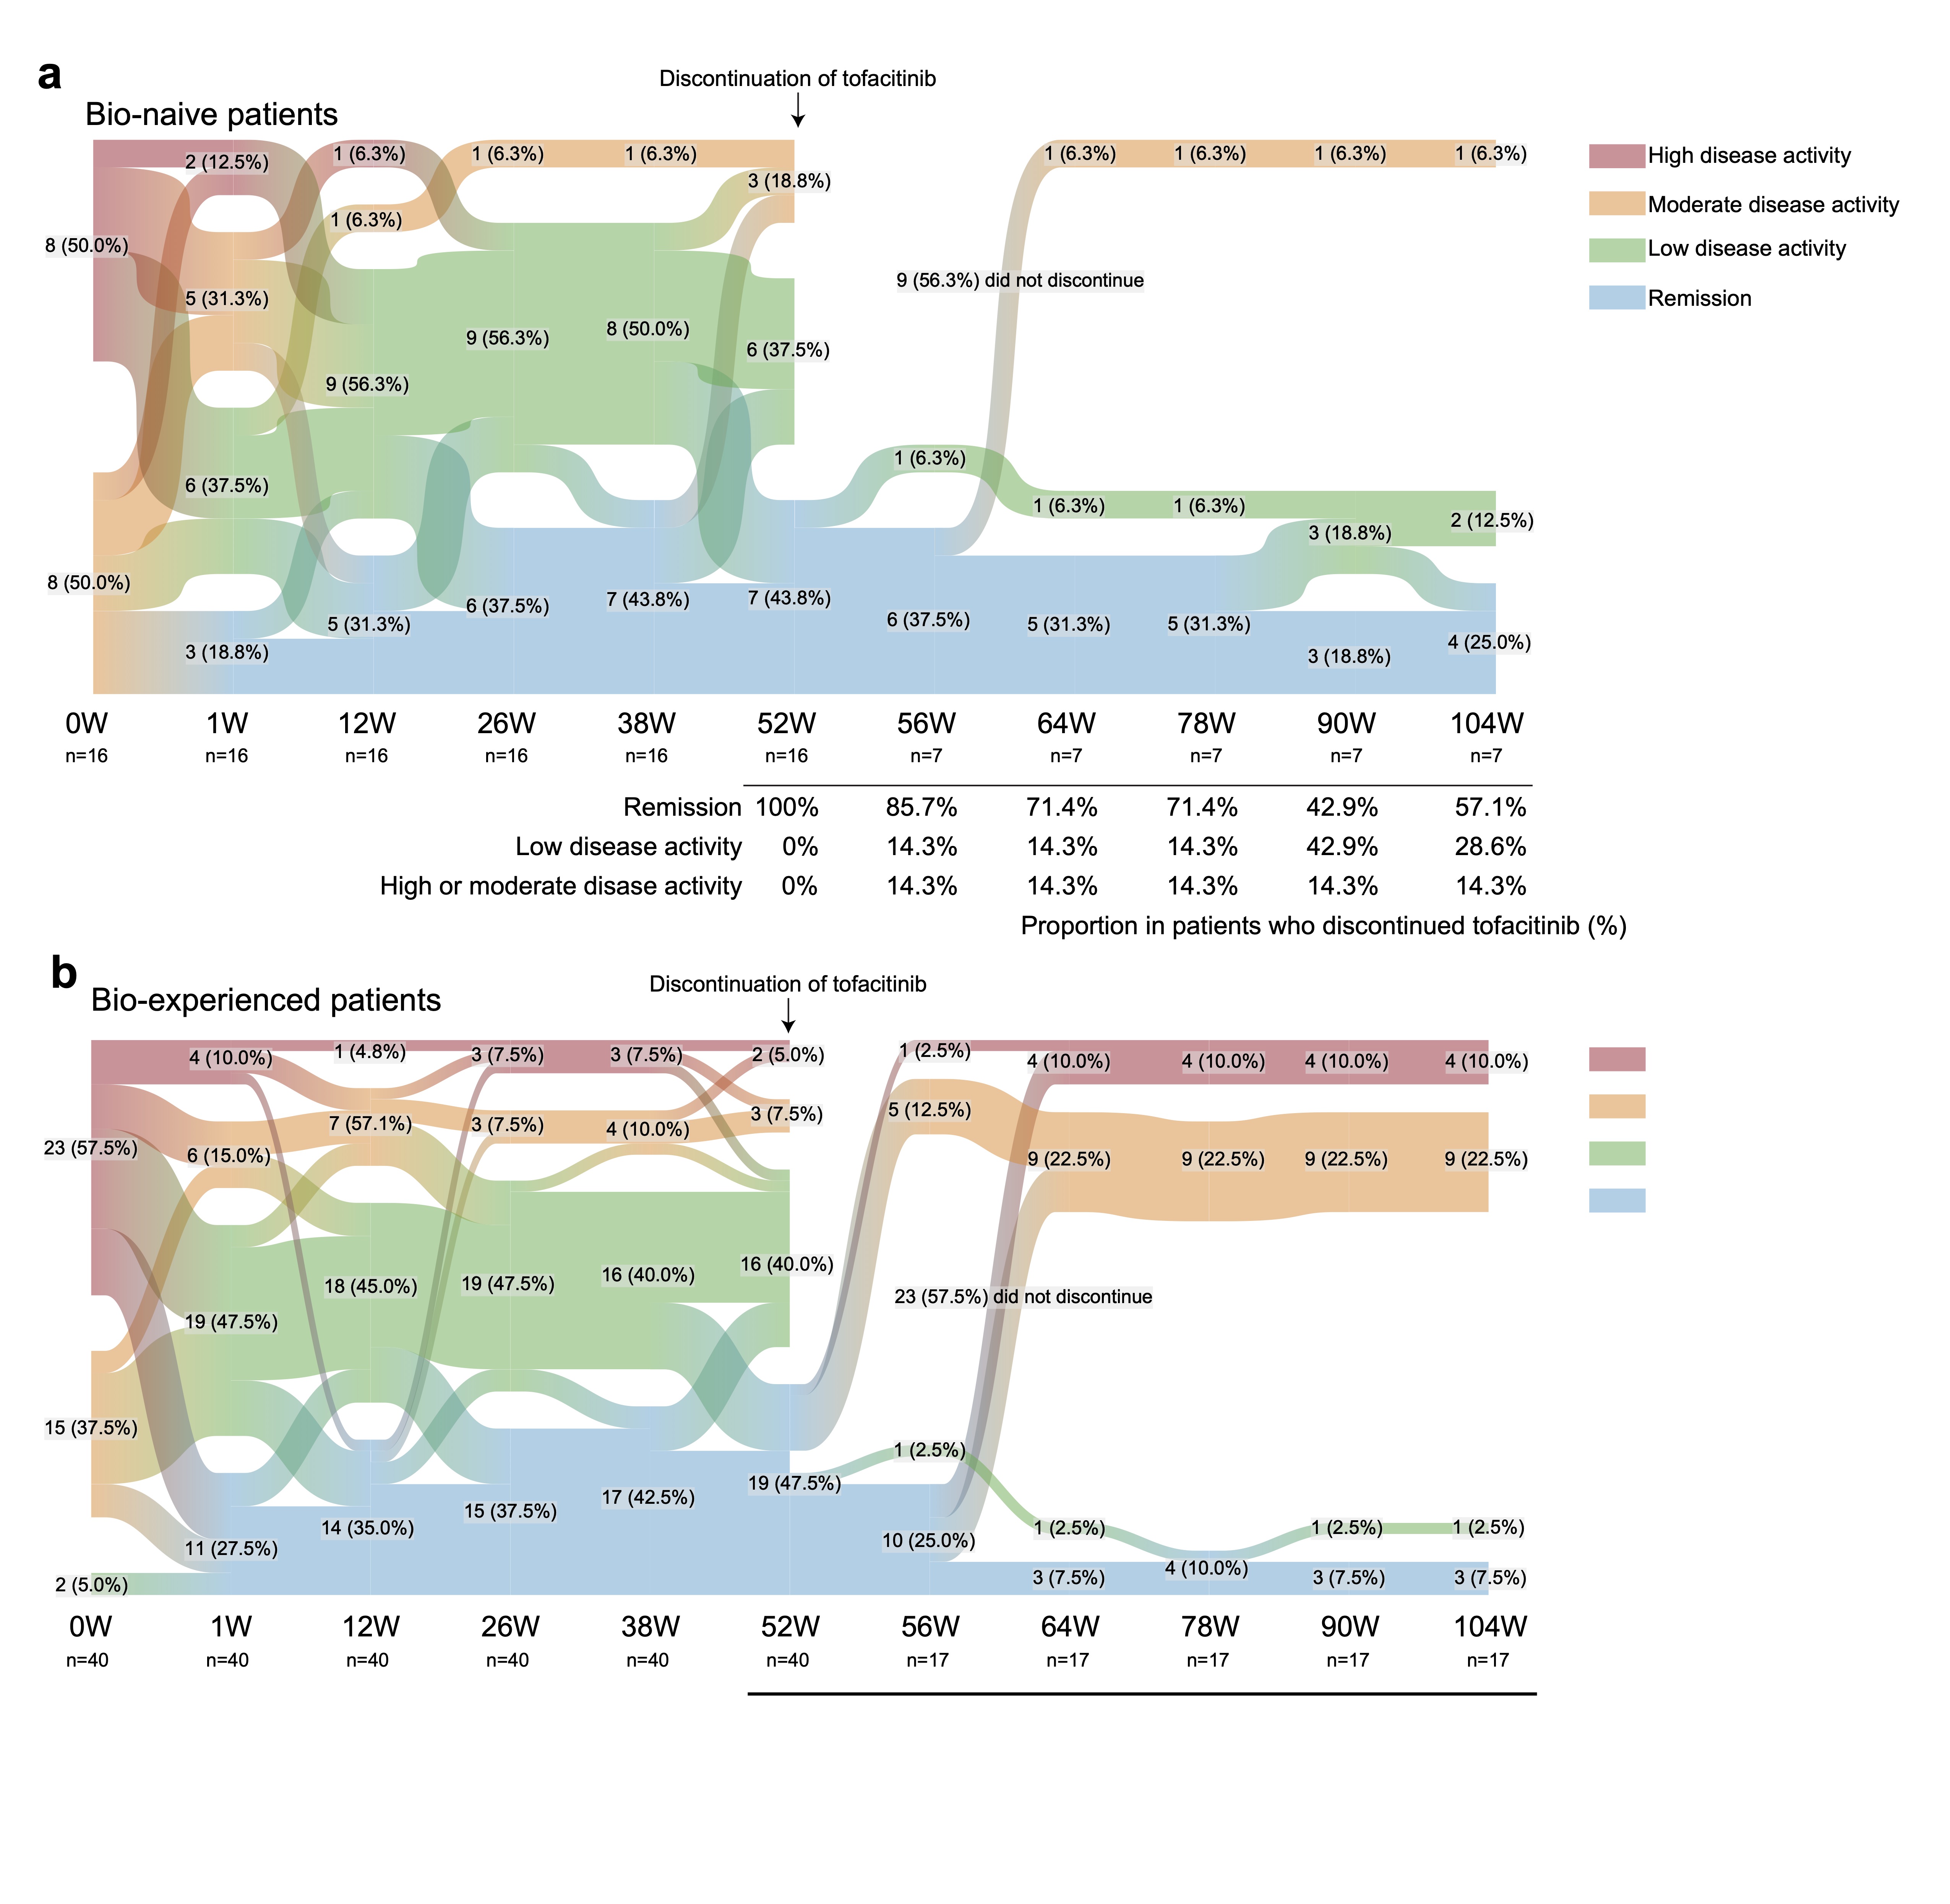 Figure 2. Sankey diagram describing proportion of patients per CDAI disease activity category over time in the subgroup. (A) Bio-naïve patients (n=16). (B) Bio-experienced patients (n=21). Data are n (%).
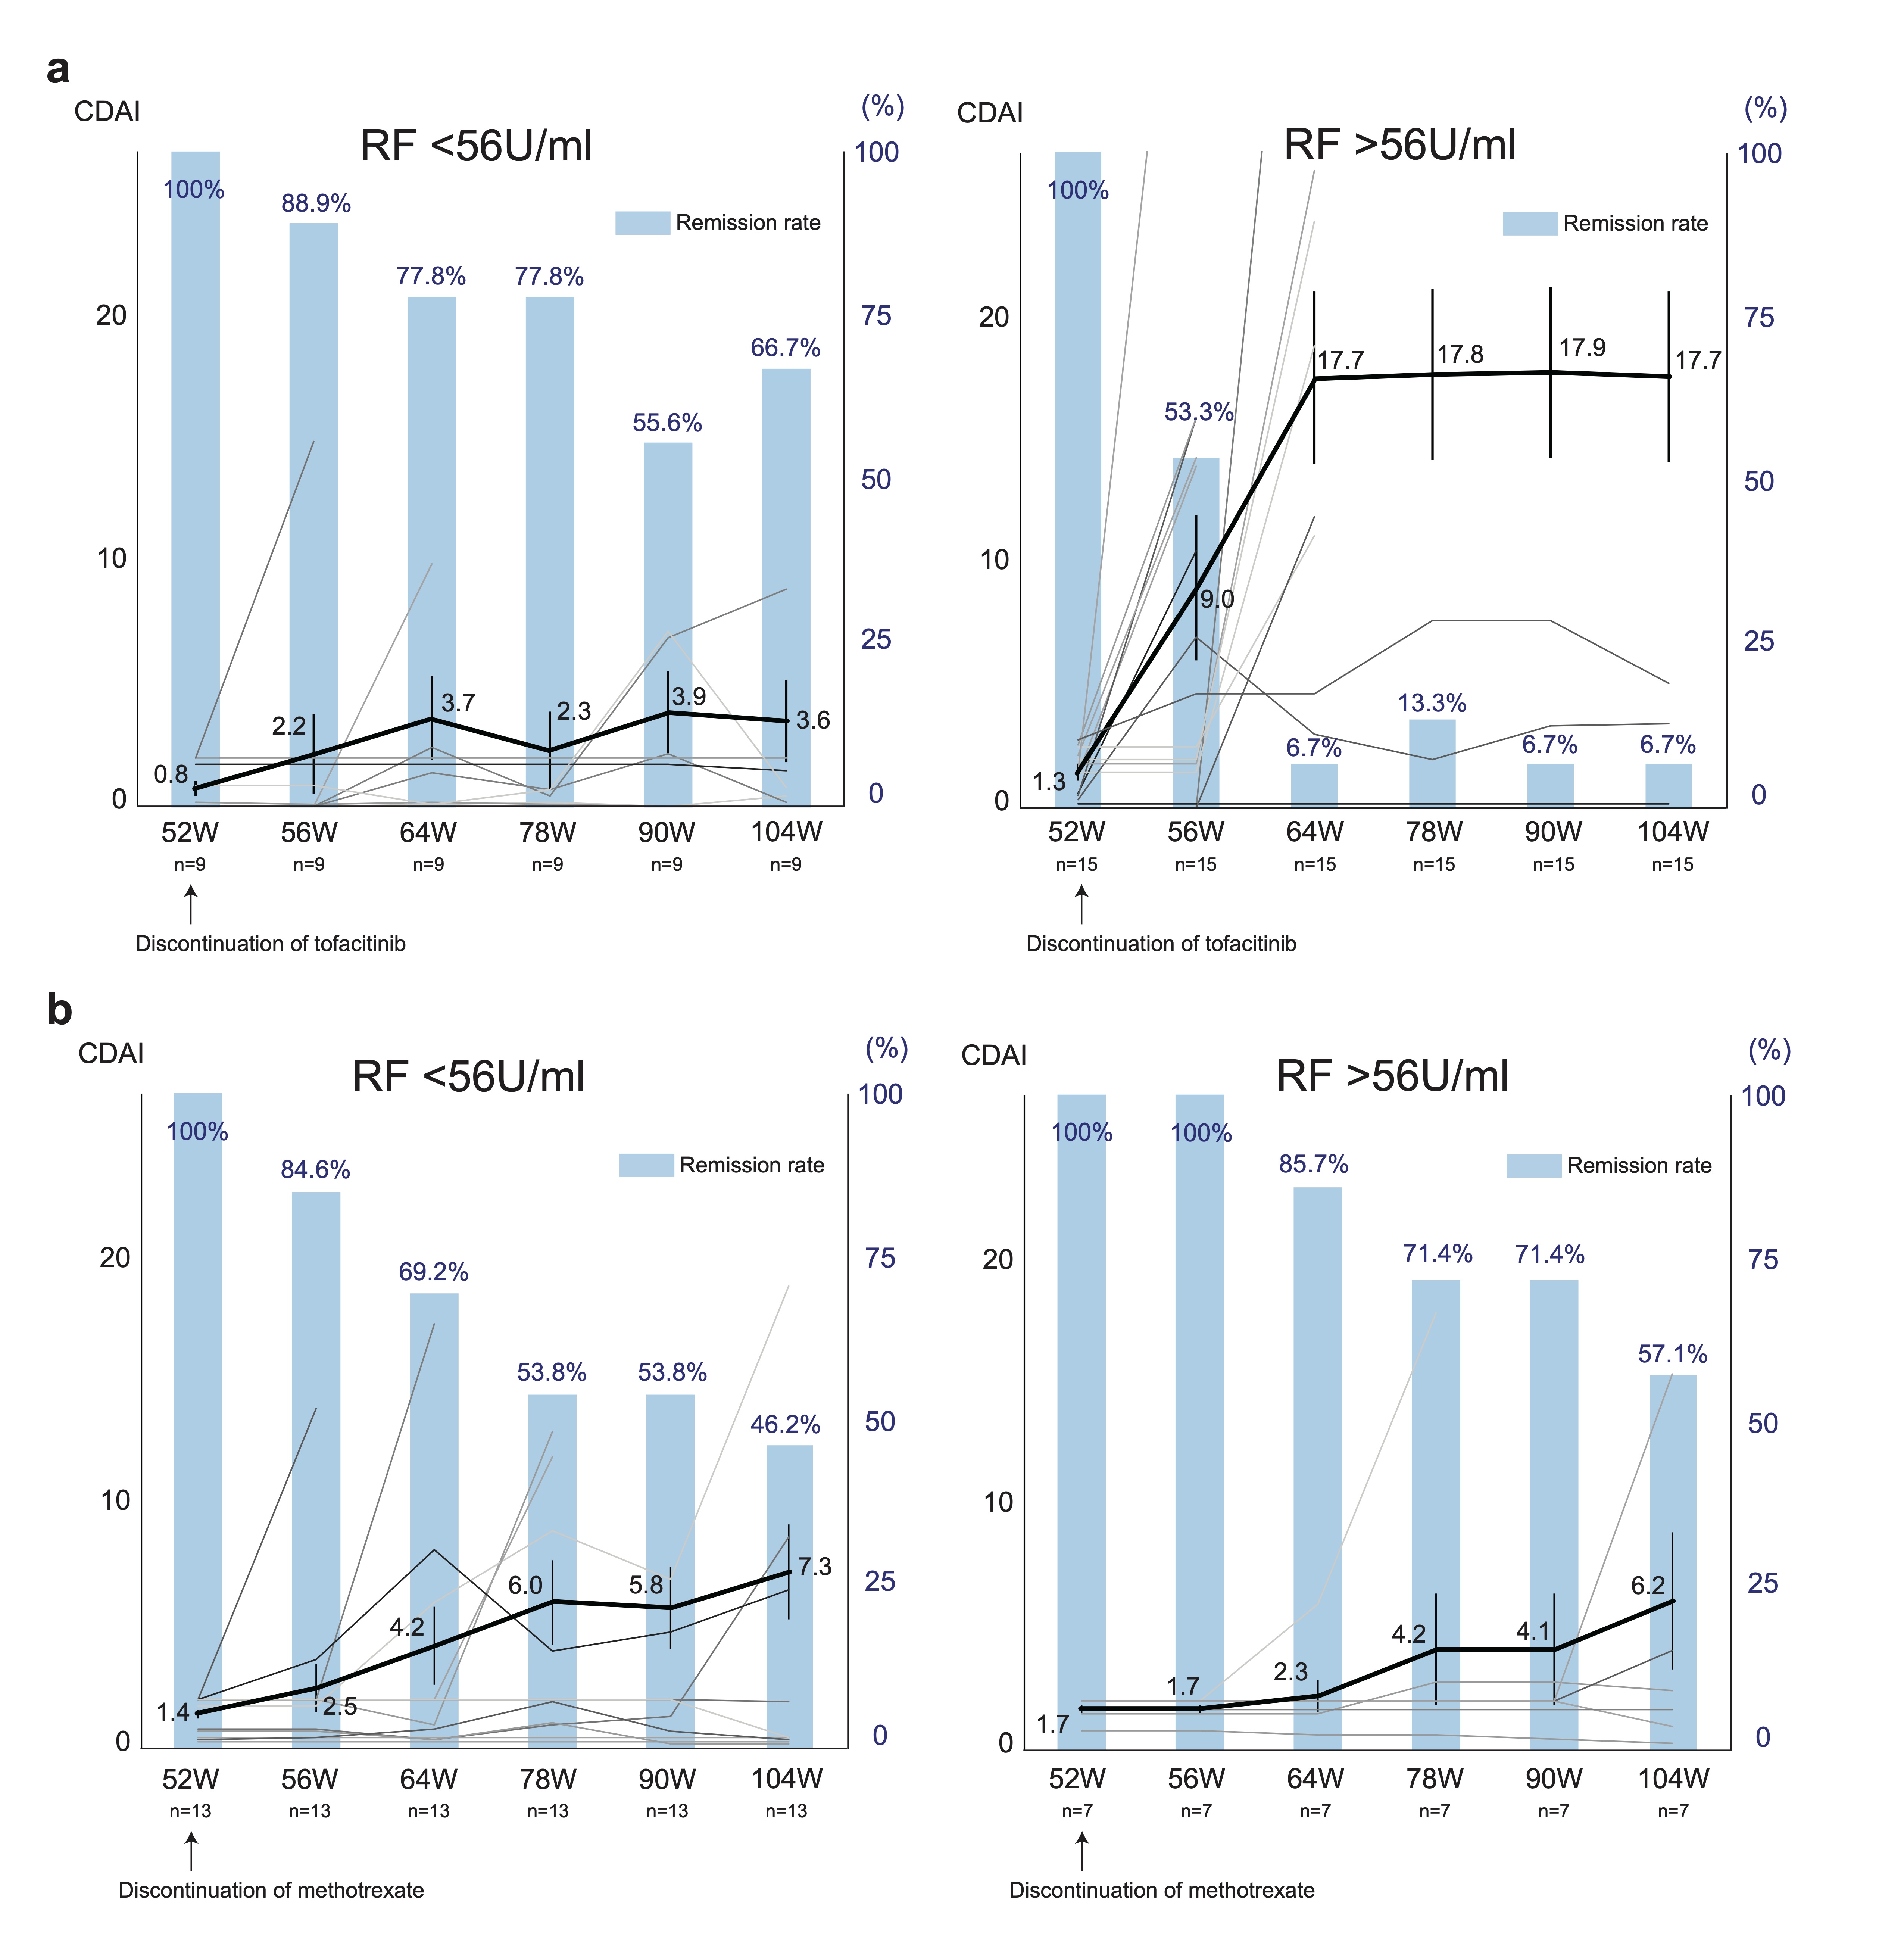 Figure 3. Serial changes in the CDAI and clinical remission according to CDAI after discontinuation of tofacitinib or methotrexate in the subgroup. Spaghetti plot (black lines: mean value, grey lines:of the values of individual patients) and bar graph of remission rate are shown. (A) RF lower titer group (left) and higher titer group (right) in the tofacitinib discontinuation arm. (B) RF lower titer group (left) and higher titer group (right) in the methotrexate discontinuation arm. Data are mean (SEM) and %.