
Abstract Session
Rheumatoid arthritis (RA)
.jpg "Nozima Aripova, BS photo")
Nozima Aripova, BS
University of Nebraska Medical Center
Omaha, NE, United States
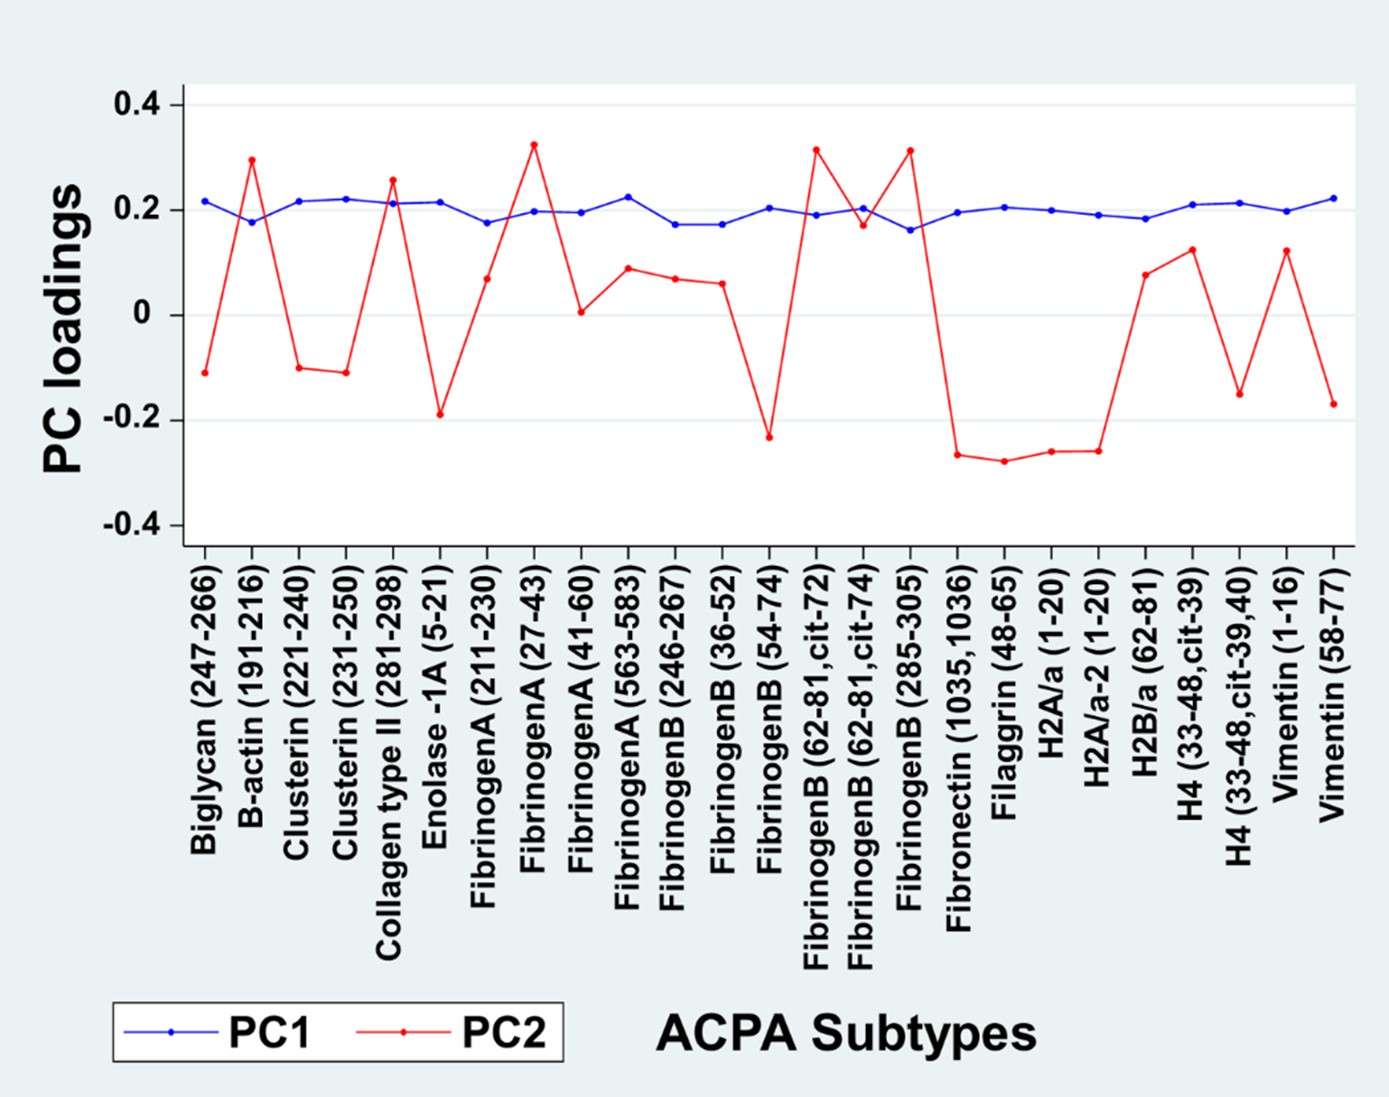 Figure 1. Loading Scores for ACPA Subtypes for PC1 and PC2 (n=1092). Individual ACPA subtype values were reduced into two principal components (PC). PC1 and PC2 represent 64% of cumulative variation of all ACPA values. PC3 demonstrated no association with treatments response and was excluded from further analyses. The loading scores for each component were tested for association with EULAR response using ordinal logistic regression.
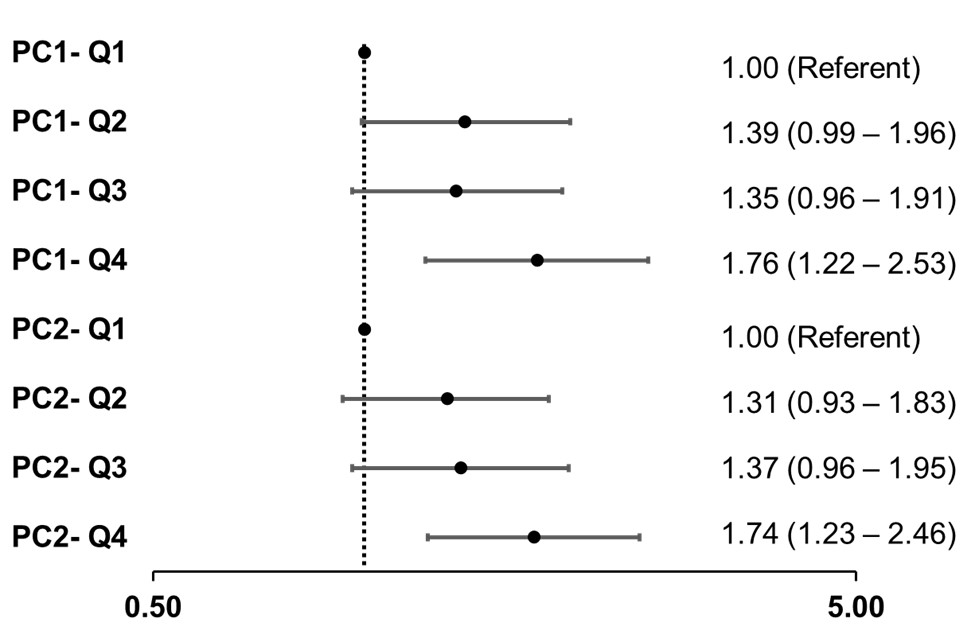 Figure 2. Associations of ACPA Subtypes PC1 and PC2 with EULAR Response (n=1092). Multivariable adjusted models developed using ordinal logistic regression. Q-quartile; PC, principal component. Results are shown from single model including PC1, PC2, and the following covariates: sex, age, race, BMI, smoking status, disease duration, baseline disease activity, diabetes, cardiovascular disease, prednisone, methotrexate, and treatment assignment.