
Abstract Session
Osteoarthritis (OA) and related disorders
Wendy Walrabenstein, MA
Amsterdam UMC
Amsterdam, Netherlands
1. Furman et al. 2019, Nat Med.
2. Messier et al. 2013, JAMA
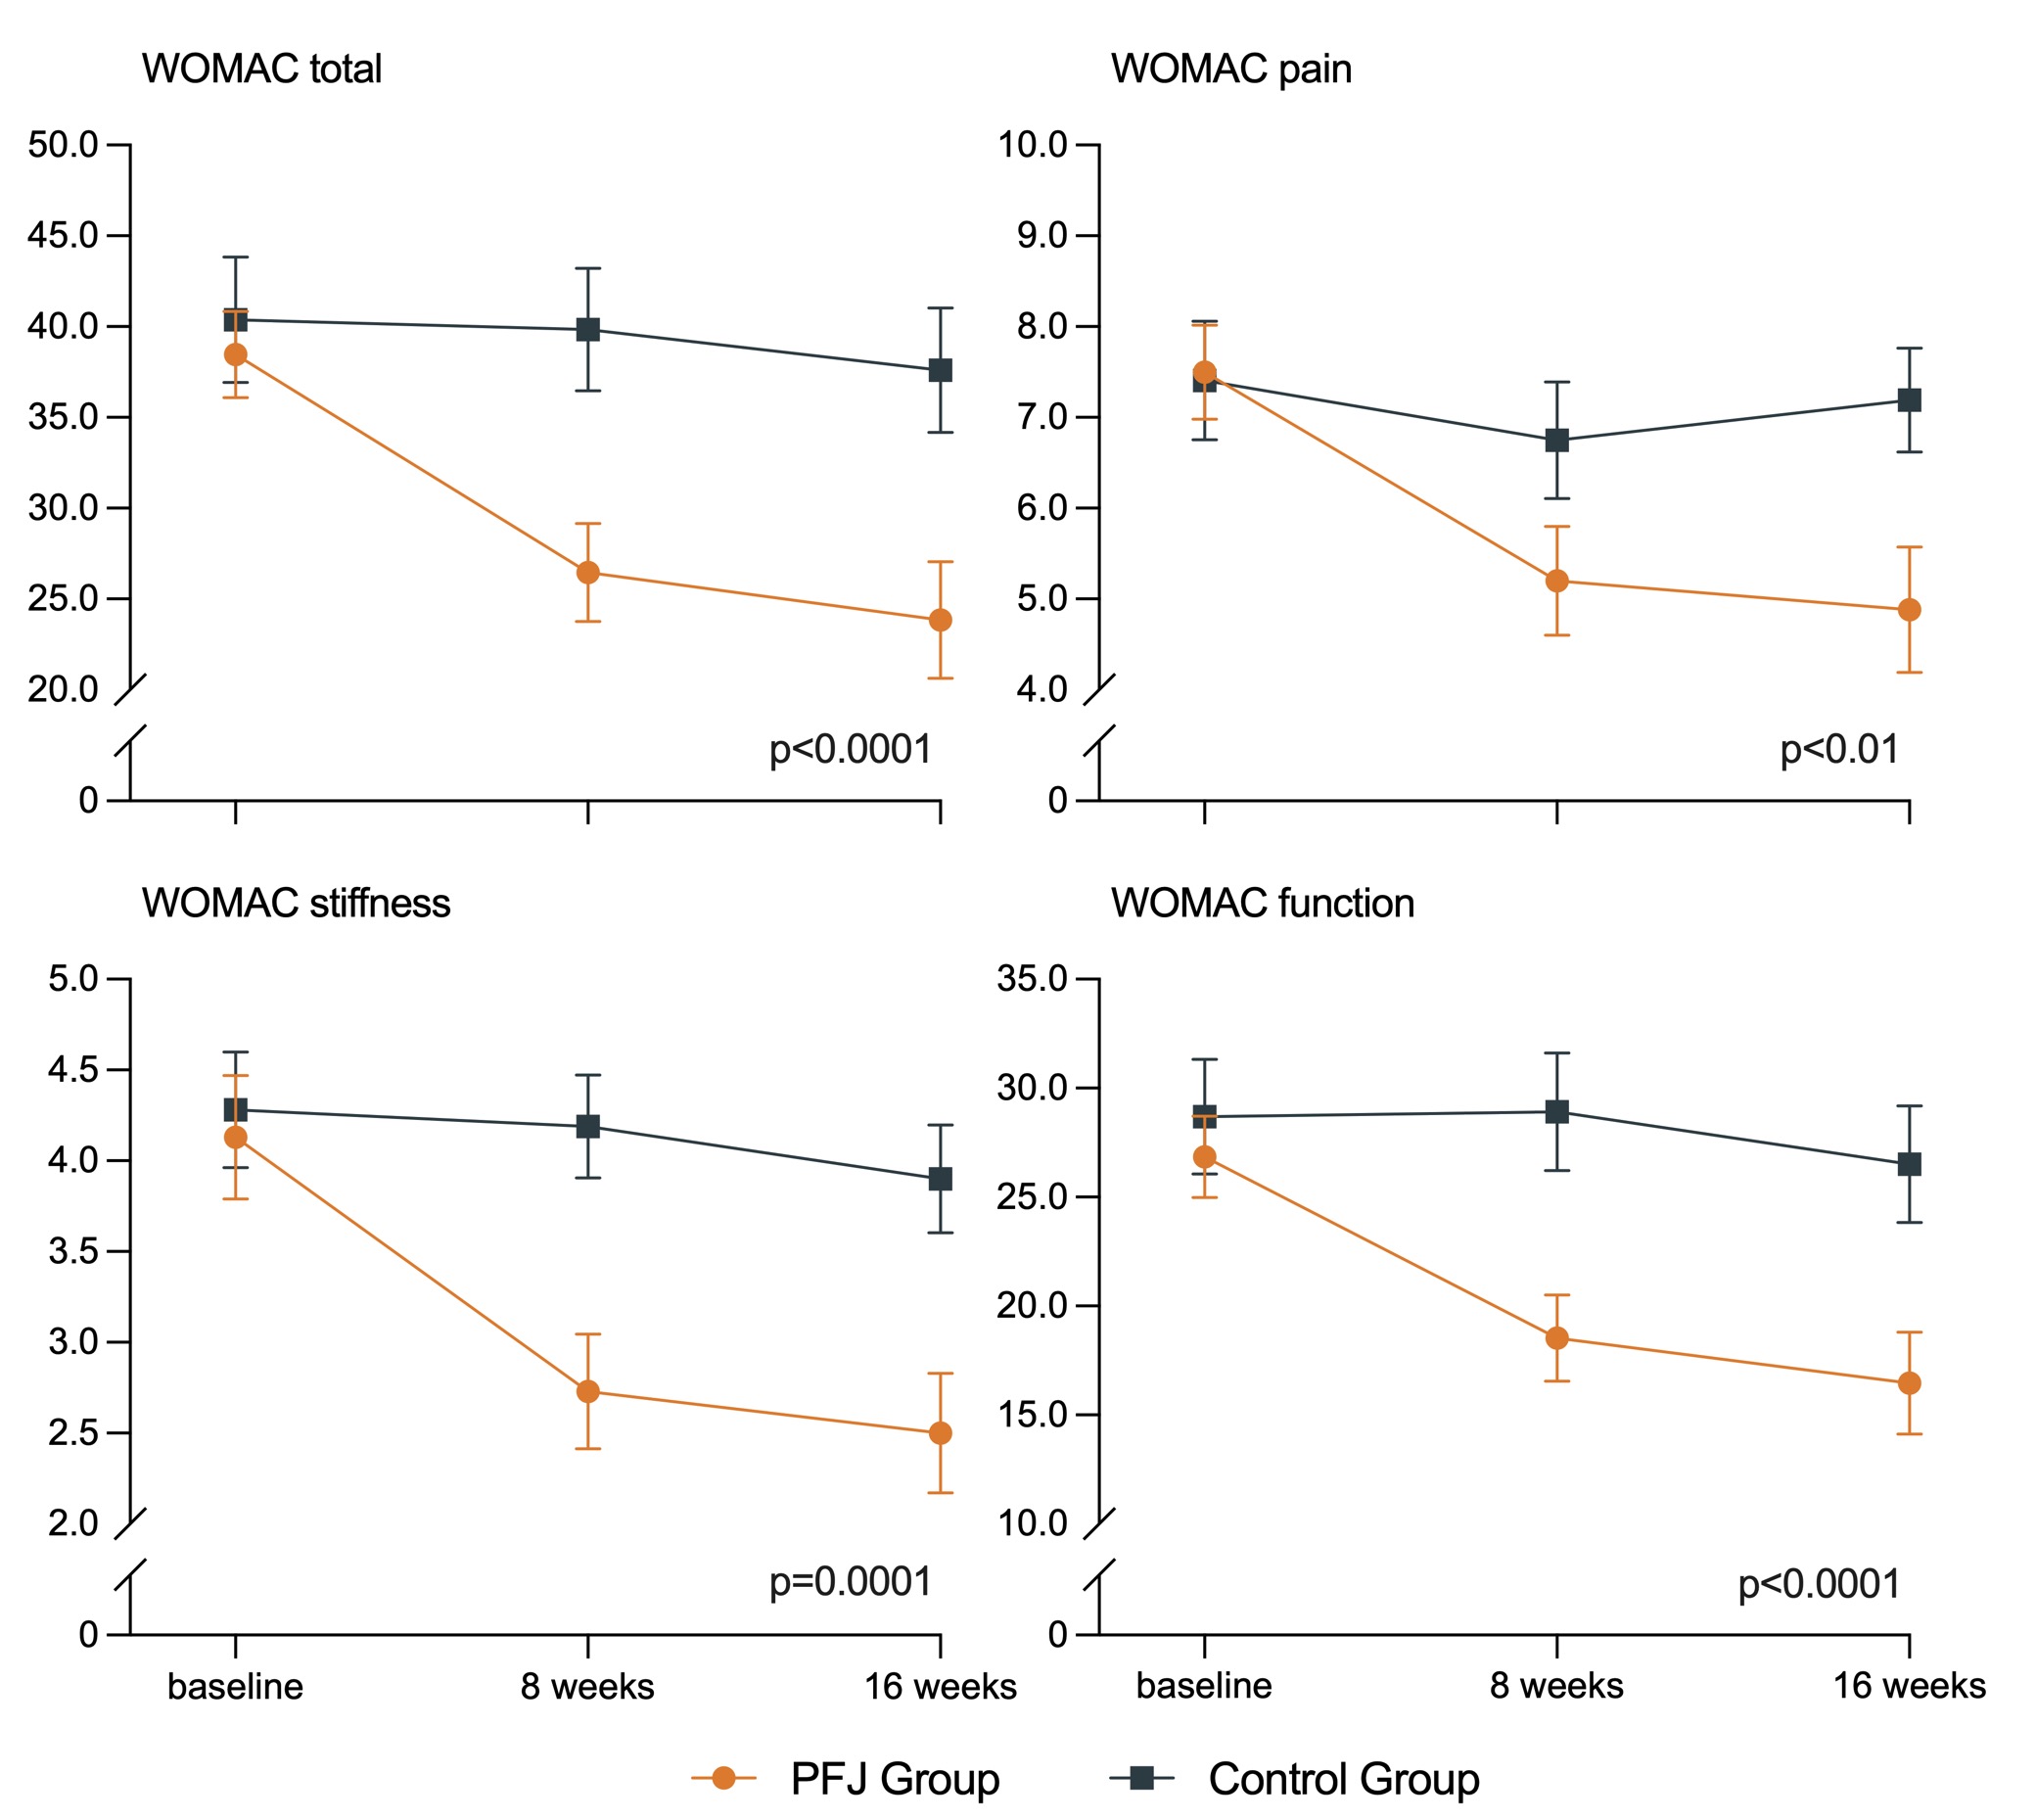 Figure 1. Change in Western Ontario and McMaster Universities Arthritis Index (WOMAC) total score (p = 0.0001) and WOMAC component scores for pain (p = 0.04), stiffness (p < 0.001) and function (p = 0.0001) for the Plants for Joints group (n = 32) when compared with the control group (n = 32). Graphs present mean ± standard error.
 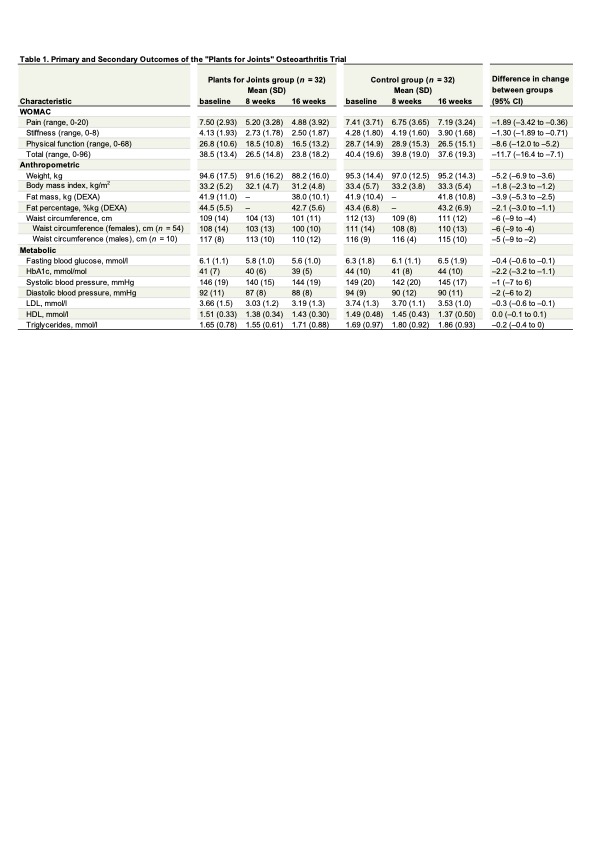 All values for the total group (n = 64), Western Ontario and McMaster Universities Arthritis Index (WOMAC), DEXA = Dual-energy X-ray absorptiometry, SD = standard deviation. Differences in change between group are based on a linear mixed model with random effect for subjects for between group analyses, adjusted for baseline values. Additional adjustment for covariates (sex, age and BMI) did not change outcomes.