
Poster Session D
Crystal arthropathies
Ira Khanna, MD
Mount Sinai Hospital
New York, NY, United States
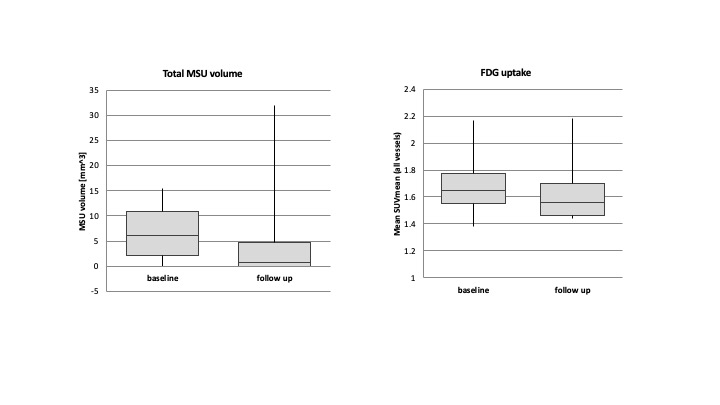 Figure 1- Bar charts showing decrease in MSU volume after treatment with Pegloticase (p=0.75), and decrease in SUV mean after treatment with Pegloticase (p=0.0003)
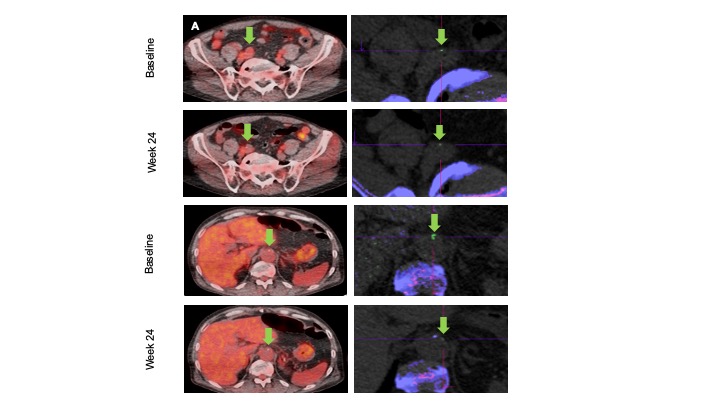 Figure 2- Representative PET/CT (left) and DECT images (right) from two axial locations in one patient. FDG uptake (orange overlay) shows inflammation in (A) the right iliac artery and (B) abdominal aorta (green arrow). On DECT, MSU deposits (green) are shown in the corresponding vessel walls (cross-hairs), with bone shown purple. In these locations, imaging shows a decrease in FDG uptake and MSU volume following treatment with Pegloticase.
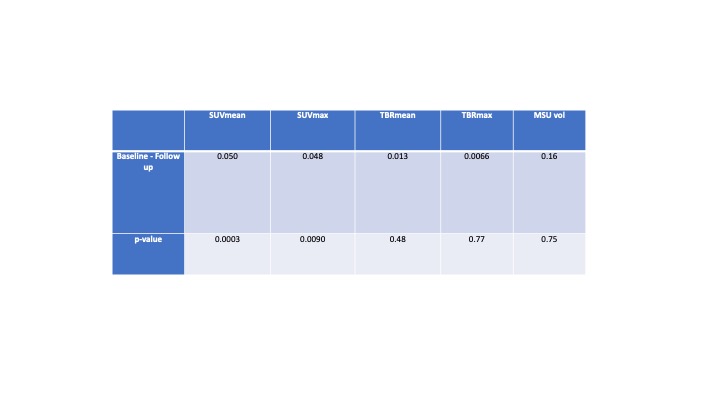 Table 1- Results of mixed-effects-model analysis. Positive difference (Baseline-Follow up) represents decrease in value at follow up. We observed a statistically significant decrease in SUVmean (p=0.0003) and SUVmax (p=0.0090) at follow up and a trend towards decrease in TBRmean, TBRmax and MSU volume at follow up (not statistically significant).