
Poster Session D
Sjögren's syndrome
Liselotte Deroo, MD
Ghent University
Gent, Belgium
.jpg) Figure 1 Hocevar scores for different endotypes in definite and suspected pSS patients in the discovery (A) and replication (B) cohort. Within the definite pSS subgroup, differences between each endotype and patients from the other endotypes were assessed by Man-Whitney U testing. Significant differences were indicated with the corresponding p-value.
Figure 1 Hocevar scores for different endotypes in definite and suspected pSS patients in the discovery (A) and replication (B) cohort. Within the definite pSS subgroup, differences between each endotype and patients from the other endotypes were assessed by Man-Whitney U testing. Significant differences were indicated with the corresponding p-value.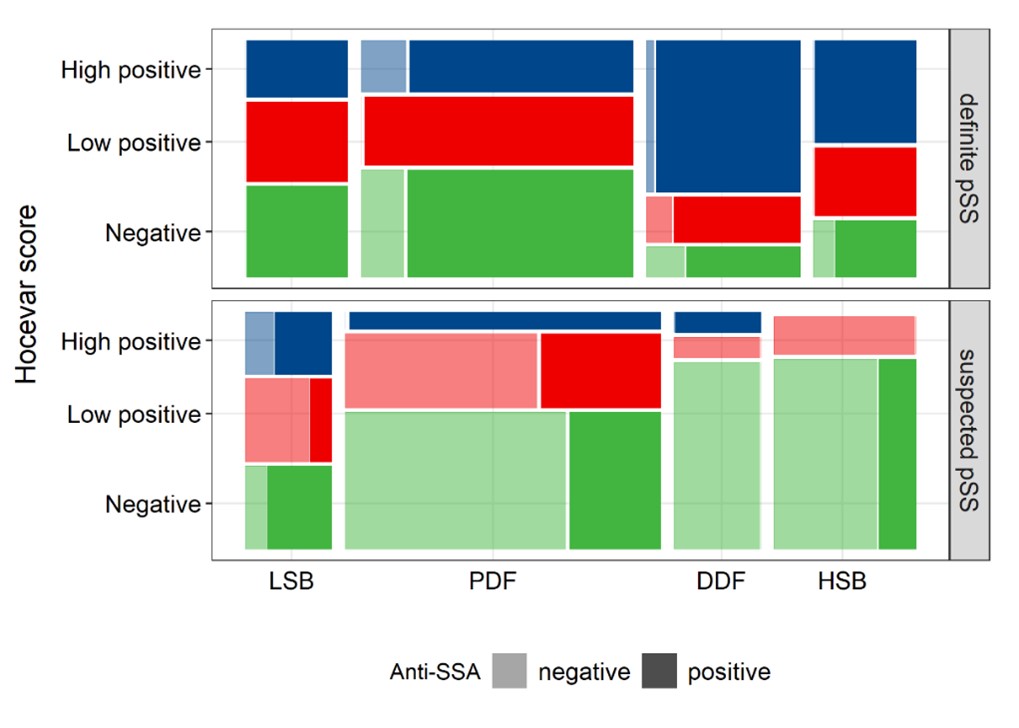 Figure 2 Mosaic plot visualizing the proportion of negative (0-14), low positive (15-26) and high positive (27-48) Hocevar scores for all endotypes both in definite and suspected pSS in the discovery cohort. Darker shades indicate the proportion anti-SSA/Ro positive patients in each subgroup. The area of each rectangle represents the number of patients in each subgroup. Abbreviations: LSB=low symptom burden; PDF=pain dominant with fatigue; DDF=dry dominant with fatigue; HSB=high symptom burden.
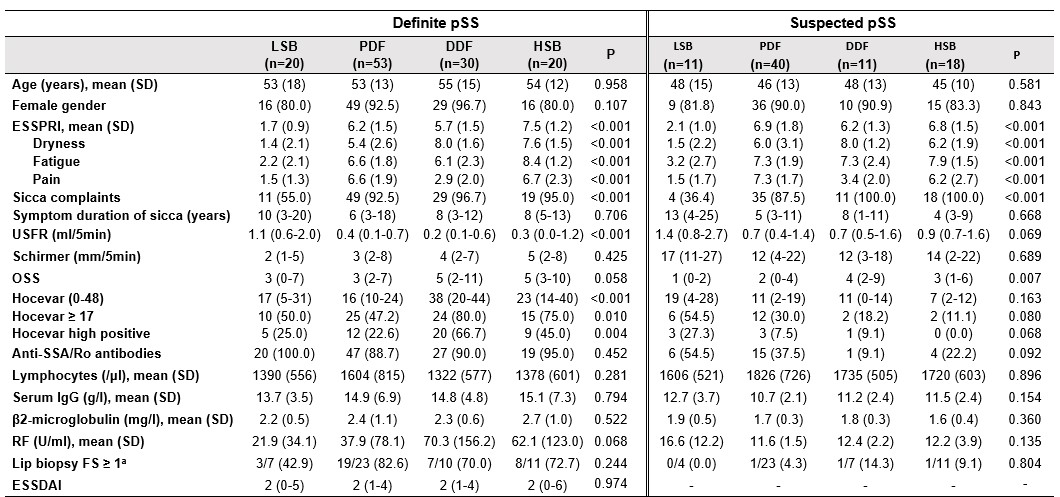 Table 1 Clinical characteristics and laboratory parameters of the discovery cohort. Continuous data presented as median (IQR) and categorical data as number of patients (%) unless otherwise indicated. P-values refer to comparison of endotypes within definite and suspected pSS subgroups, based on Kruskal-Wallis or Chi-squared tests. aResults are reported as the ratio aberrant on available biopsies. Abbreviations: ESSPRI=EULAR Sjögren's syndrome patient reported index; USFR=unstimulated salivary flow rate; OSS=ocular staining score; FS=focus score; ESSDAI=EULAR Sjögren's syndrome disease activity index.