
Poster Session A
Pediatric autoimmune diseases: Kawasaki disease, juvenile dermatomyositis and juvenile localized scleroderma
Jessica L. Turnier, MD, MS
University of Michigan
Saline, MI, United States
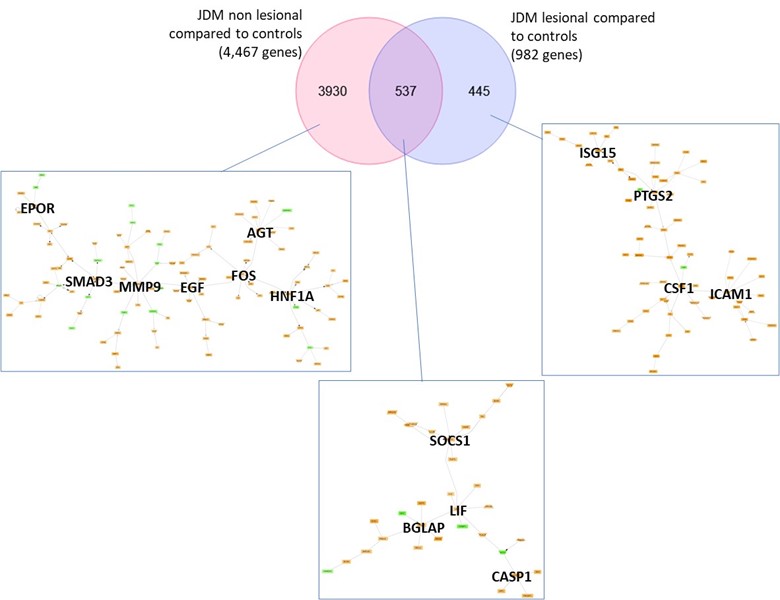 Figure 1. Transcriptomic comparison of JDM_L and JDM_NL skin compared to CTL (q-value ≤ 10%) using DEGS to generate GePS networks. The pictures display the 100 best connected genes co-cited in PubMed abstracts in the same sentence linked to a function word (most relevant genes/interactions). Orange represents the genes that are upregulated and green represent the genes that are downregulated in JDM_NL and/or JDM_L compared to CTL.
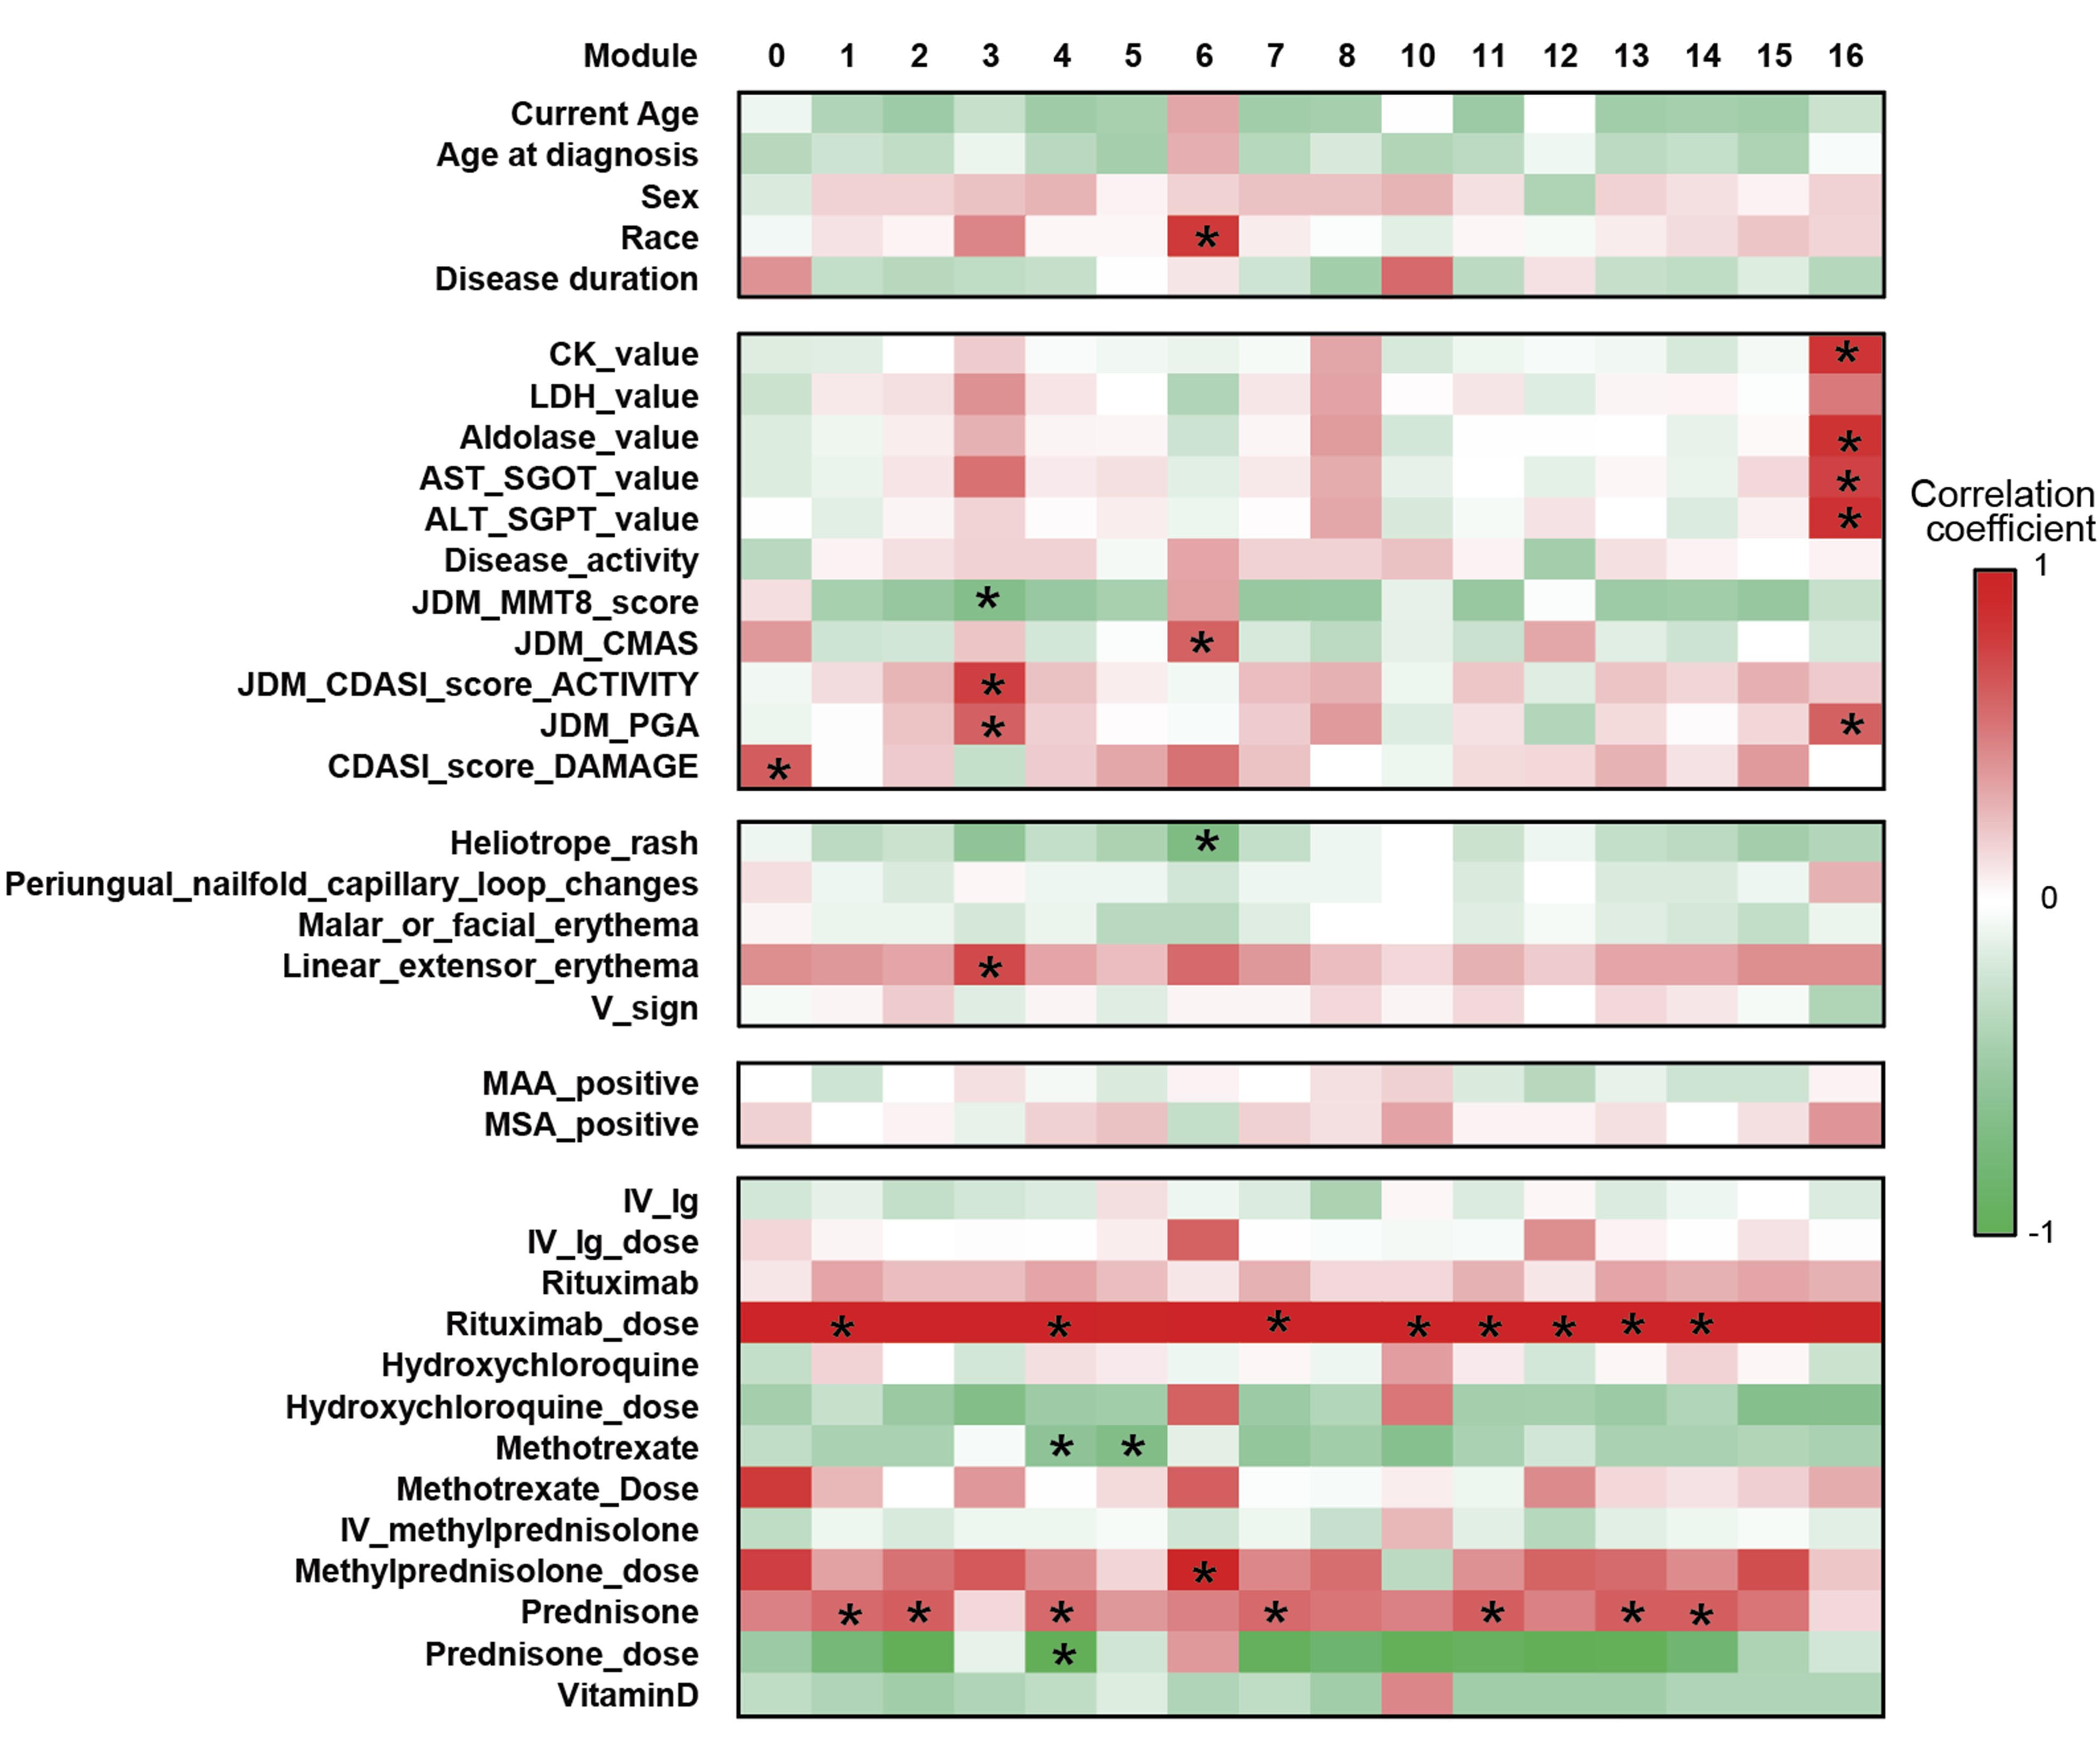 Figure 2. Association of gene modules identified by WGCNA with JDM clinical features and disease activity measures. Heatmap displaying the correlation value of z-scores from the JDM_L WGCNA gene expression modules with clinical correlates. Each column represents a gene module, each row represents a different clinical correlate. Correlation coefficients are depicted using the color scale shown with red and green indicating positive and negative correlation respectively. Significant associations on the heatmap are depicted by an asterisk (p-value < 0.05).
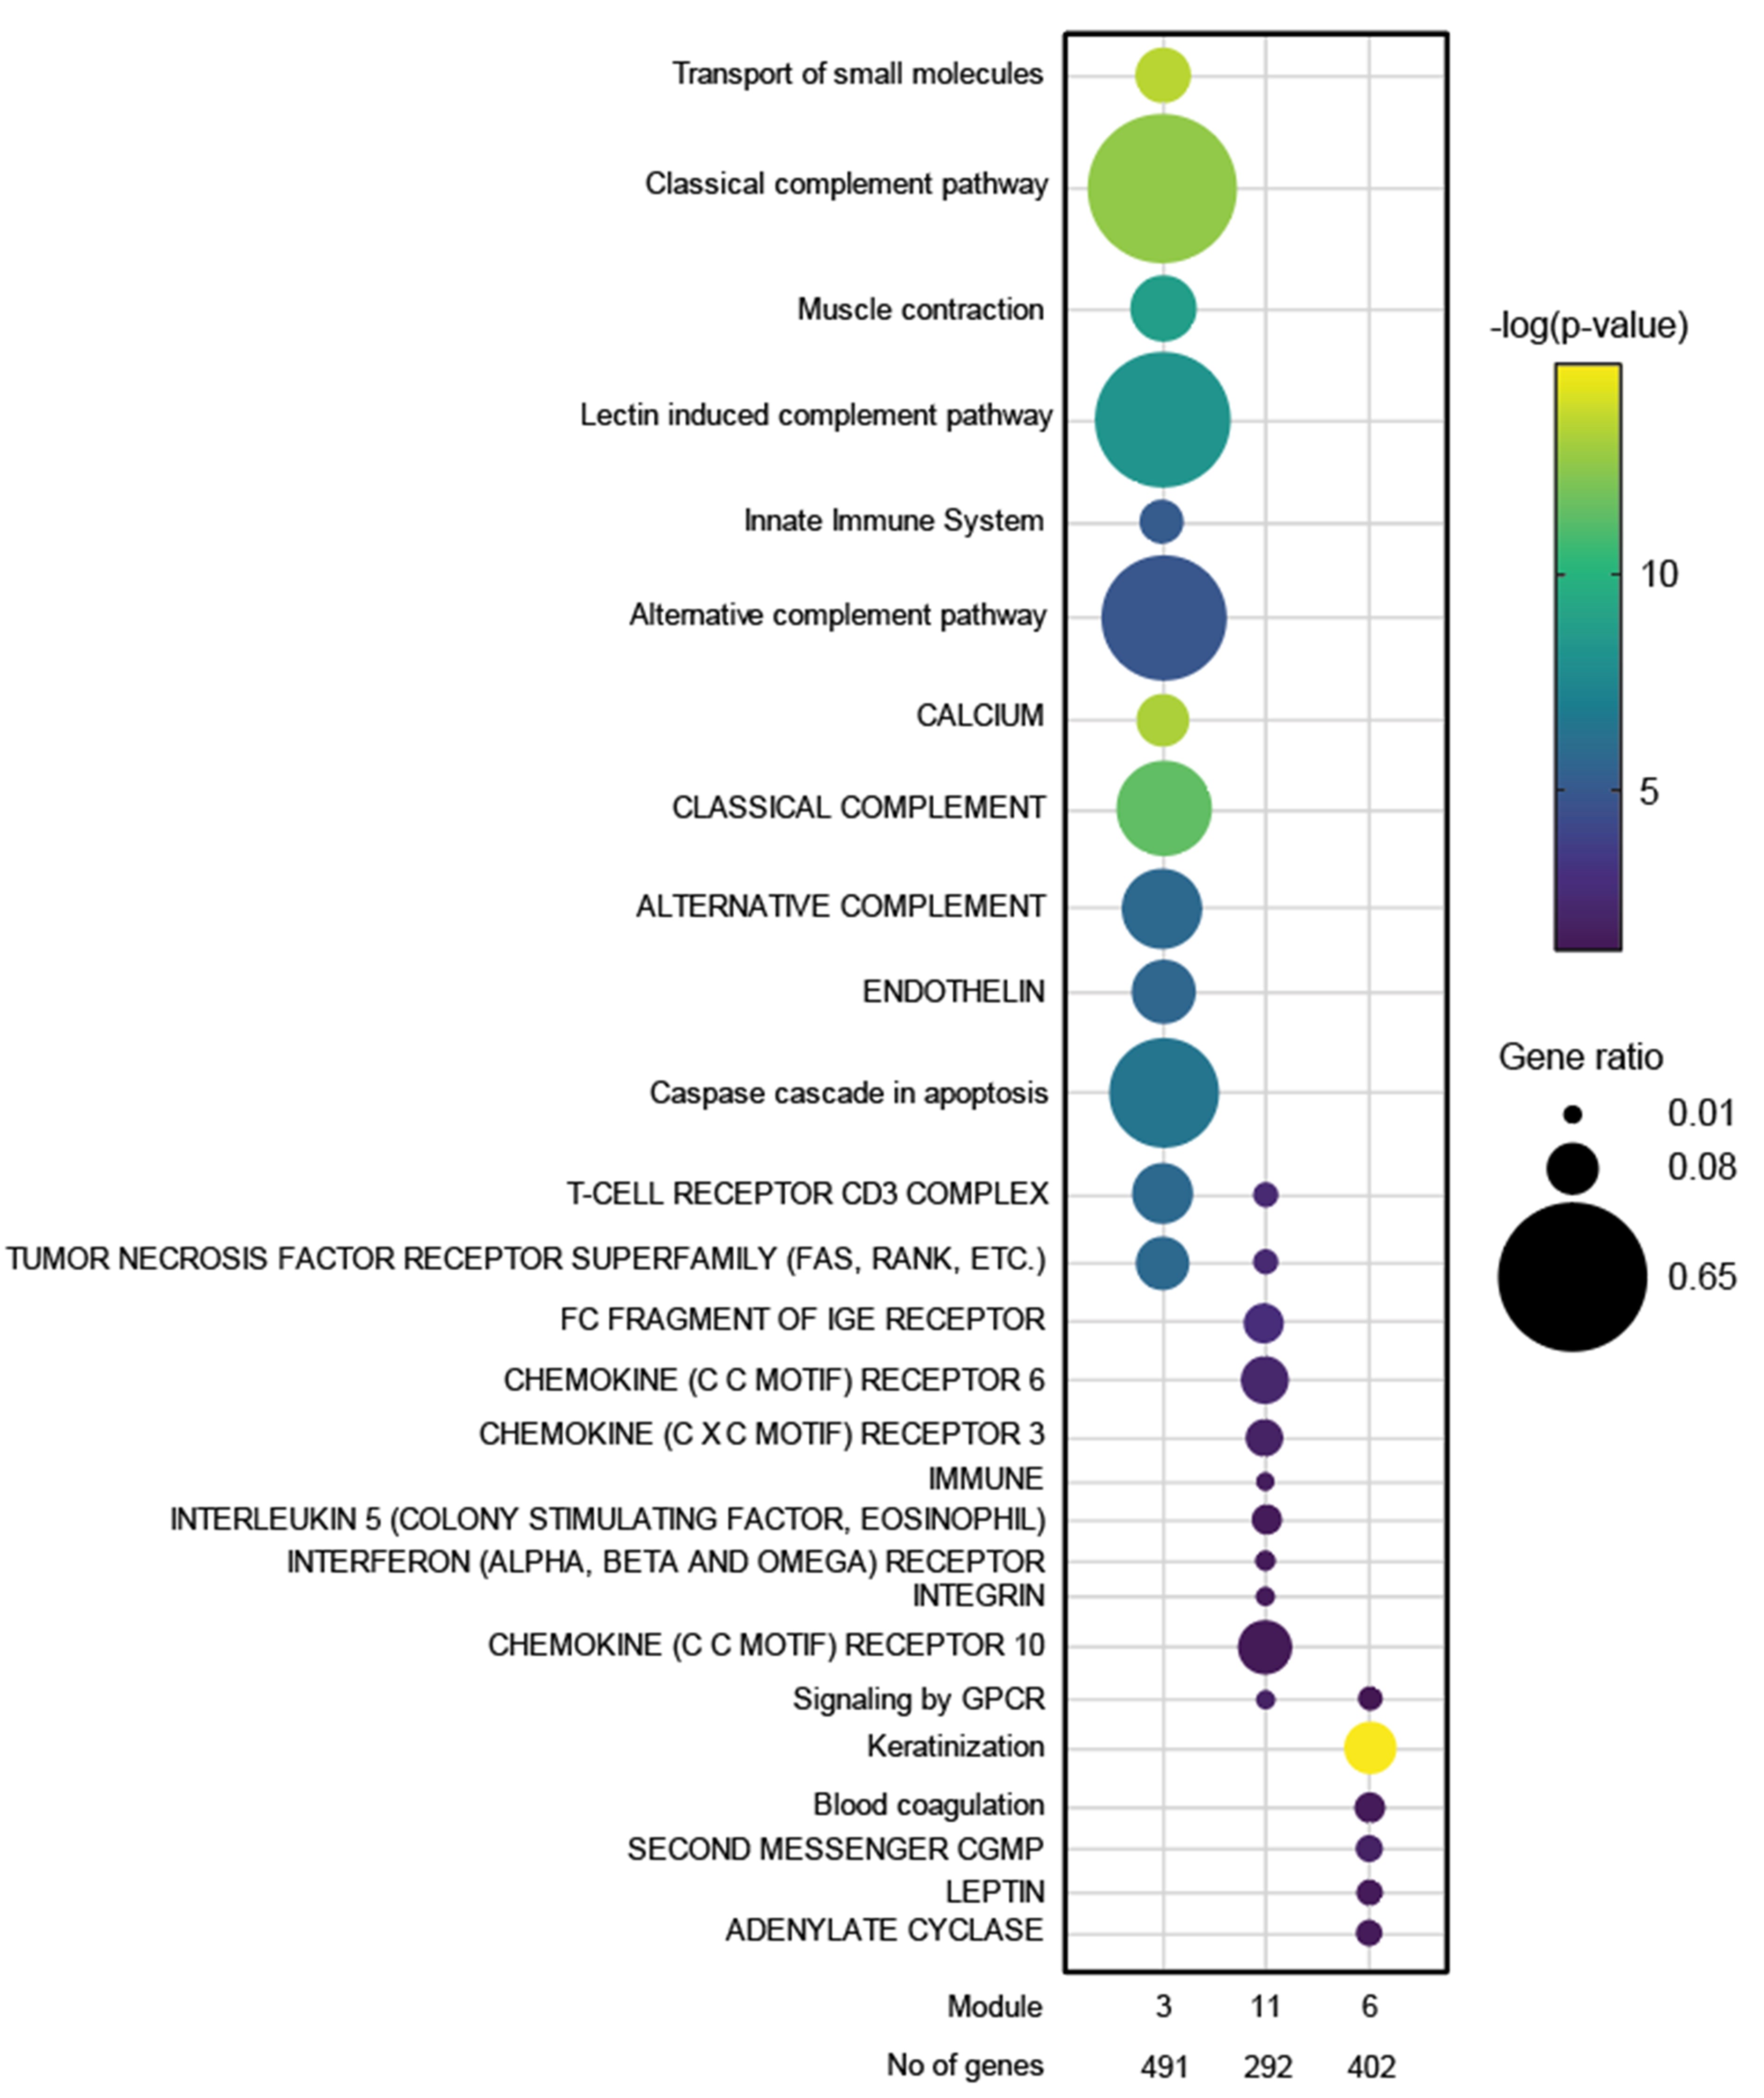 Figure 3. Dot plot representation of the top regulated GePS pathway-based networks (lower case) and pathway transduction networks (upper case) from JDM_L selected WGCNA modules (p < 0.05). The dot size represents the number of genes regulated in each pathway compared to the total number of genes in the pathway (gene ratio). The dot color represents the -log(p-value).