
Poster Session A - Sunday Afternoon
Markos Kalligeros, MD
Brown University
Providence, RI
| Table 1a. Group Summary Table | ||
| Research focused Mean [95% C.I.] | Clinical focused Mean [95% C.I.] | |
| Grouping variables | ||
| Frequencies | 27 | 22 |
| Advanced Degree | 52% [33%-70%] | 32% [16%-54%] |
| Physicians per Capita | 296 [288-304] | 326 [301-351] |
| Years Training | 6.19 [5.3-7.22] | 5.91 [4.96-7.05] |
| Outcomes | ||
| H Index | 42.7 [32.8-52.7] | 21.8 [10.3-33.3] |
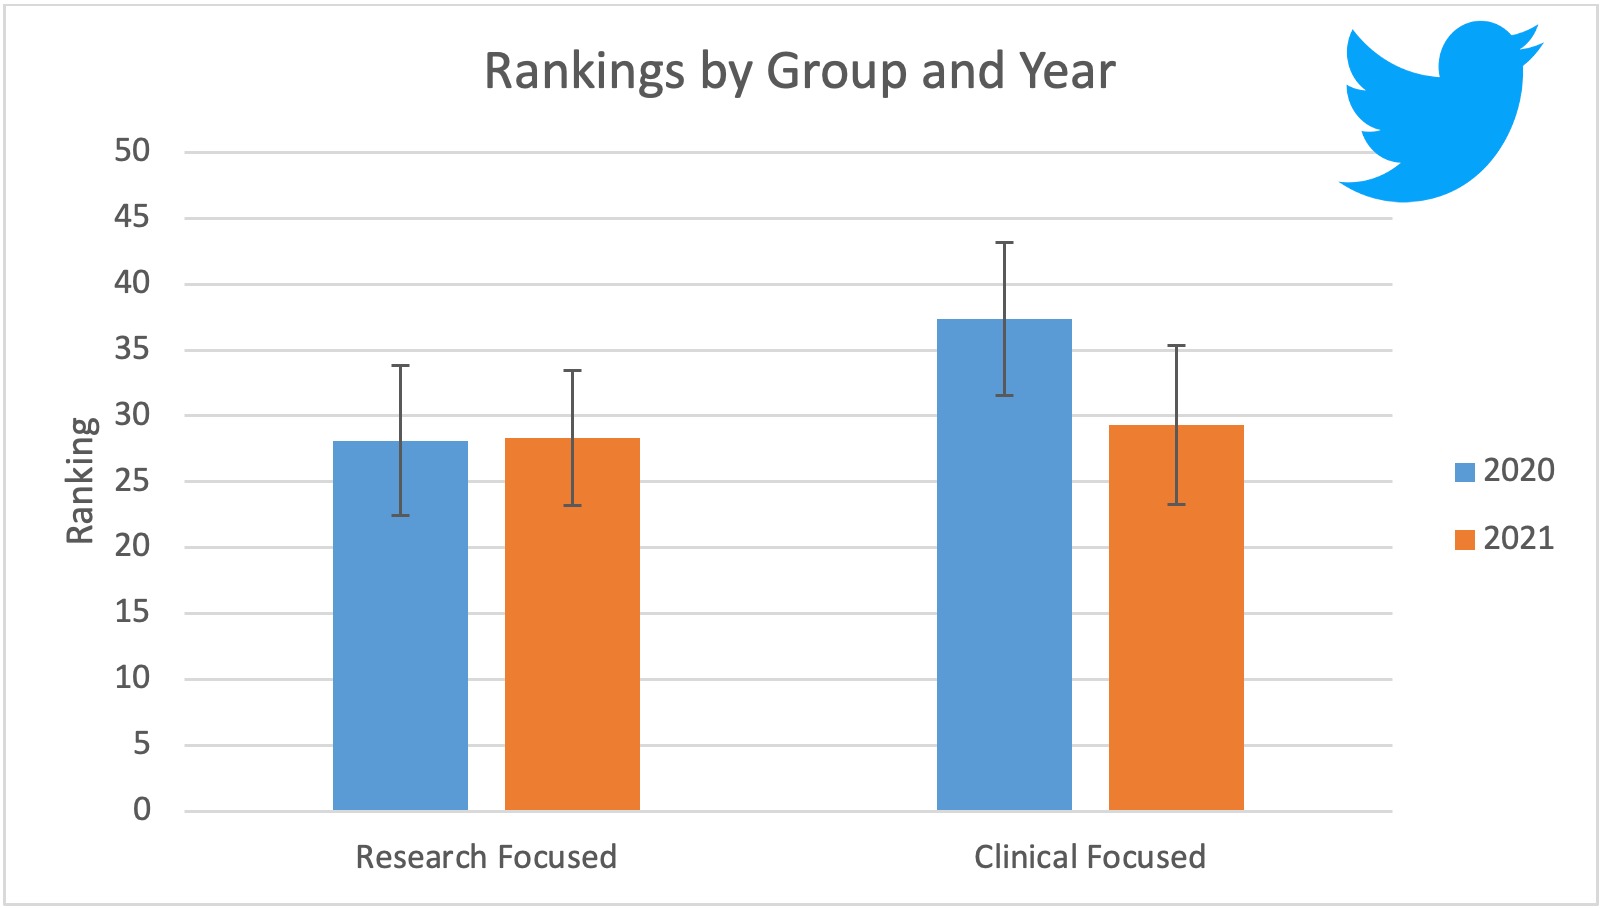
| Rankings | 28.2 [23.5-33.0] | 33.3 [28.2-38.5.0] |
Table 1b. Hypothesis Tests | ||
| X2 | P-value | |
| Empirical grouping between years | 0.55 | 0.759 |
| Comparing H Index Scores | ||
| Empirical groupings | 3.65 | 0.160 |
| Year | 4.55 | 0.032 |
| Empirical groupings by year | 6.27 | 0.043 |
| Comparing Rankings | ||
| Empirical groupings | 5.47 | 0.065 |
| Year | 0.11 | 0.735 |
| Empirical groupings by year | 11.01 | 0.004 |