All You Need Is ArcGIS Online and ArcGIS Living Atlas of the World
One weekend in early August, a red-and-white DC-10 flew over Redlands, California, where Esri is headquartered.
It was a fire response plane, an all-too-familiar sight in Southern California at this time of year.
To the east, a huge smoke plume rose through the trees. A nearby lookout provided a better view of what would turn out to be the massive Apple Fire. But where exactly was the wildfire located and how big was it? To map fires like the Apple Fire (which eventually consumed more than 33,000 acres near Cherry Valley, California) and learn more about them, you can use tools in ArcGIS Online and content from ArcGIS Living Atlas of the World.
In this Tech Time tip, you will learn how to map any fire in about a minute, locate the hot spots, find out how many people live in the affected area, and much more.
Make a Fire Map
ArcGIS Living Atlas of the World includes authoritative live feeds and other content that help you learn more about a fire and its status and conditions. Follow these steps to make your own fire map in a minute.
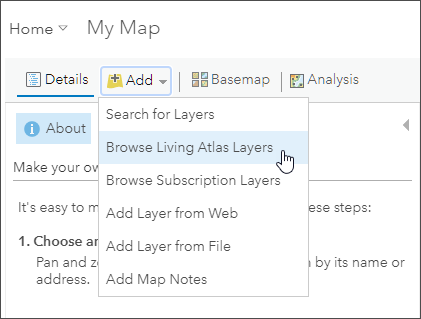
Step 1: Open Map Viewer in ArcGIS Online, click Add, then choose Browse Living Atlas Layers.
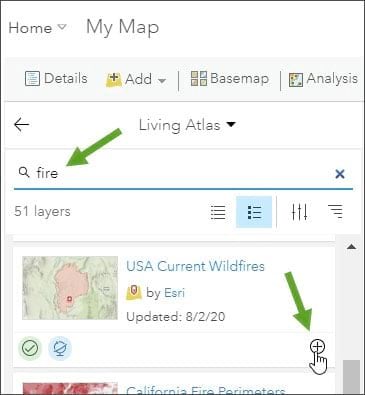
Step 2: Type “fire” in the search box to locate matching layers from the Living Atlas. Scroll to find the USA Current Wildfires layer and click the plus sign (+) to add the layer to the map.
Note: To learn more about any layer, click the layer title to view the item details.
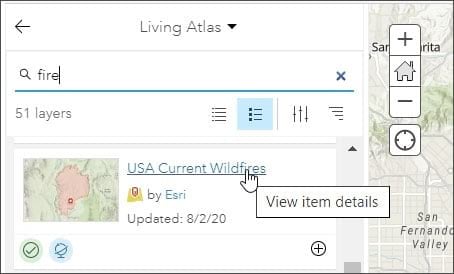
From the USA Current Wildfire item details, we learn that wildfire points are sourced from Integrated Reporting of Wildland-Fire Information (IRWIN) and perimeters are sourced from the National Interagency Fire Center (NIFC). The layer is updated every 15 minutes.
Step 3: Using the same “fire” search, locate the Satellite (VIIRS) Thermal Hotspots and Fire Activity layer, then click the plus sign to add it to the map.
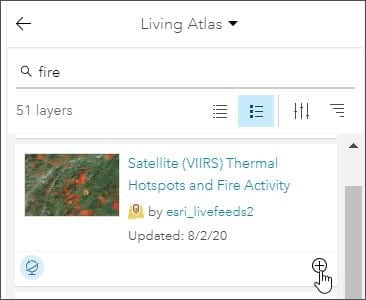
From the item details, we learn that this layer represents the most frequently updated and most detailed global, remotely sensed wildfire information. Using this layer, you can visualize and assess wildfires worldwide, including the fire of interest, the Apple Fire.
Create Your Apple Fire Map
On your map, zoom in to the area north of Banning and Beaumont, in Southern California. You will see a symbol for the Apple Fire and the fire perimeter along with the satellite visible infrared imaging radiometer suite (VIIRS) thermal hot spots.
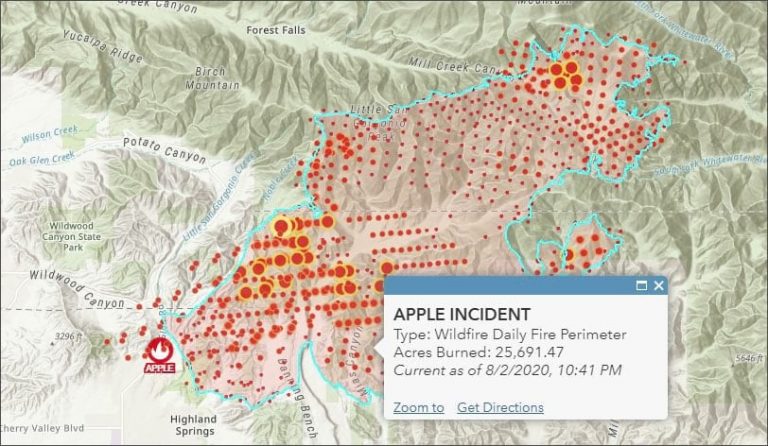
You can apply other tools to the perimeter and add Living Atlas content to provide more context about the wildfire.
Here are some examples.
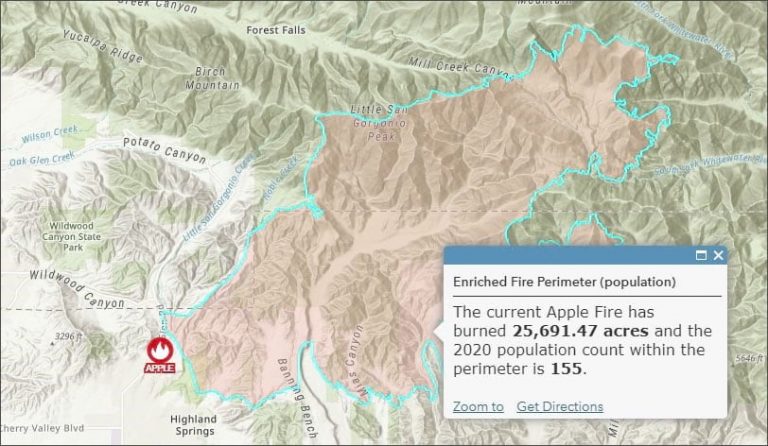
Create a Geoenriched Fire Perimeter
You can use the Enrich Layer analysis tool in ArcGIS Online to add 2020 population data to the perimeter. The configured results in the perimeter pop-up show that the area is sparsely populated. See the Enrich Layer page for more information.
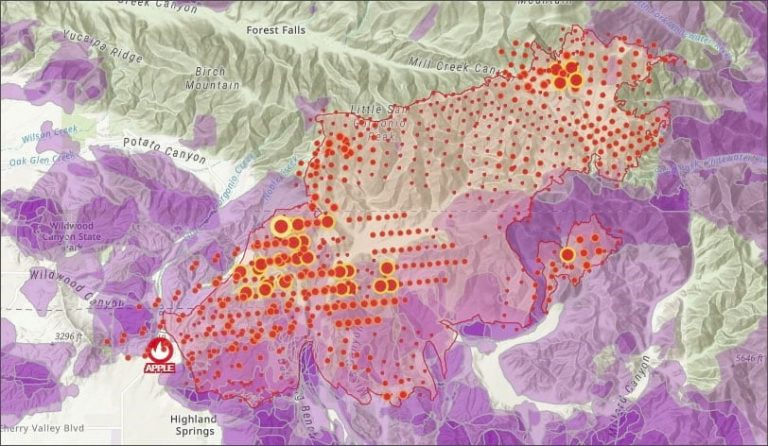
Add Historic Fire Boundaries
The map below shows the Apple Fire perimeter (in red) with Living Atlas historic fire perimeters (in purple) dating back to 1878. See the California Fire Perimeters 1878–2018 item details for more information.
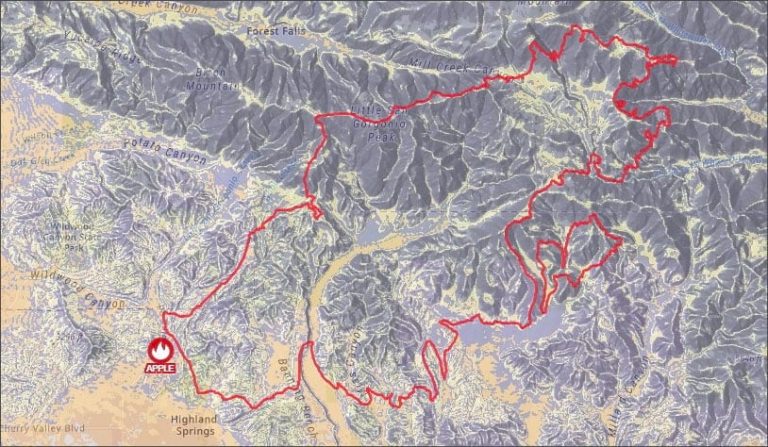
Add Slope
The influence of slope is a significant factor in fire behavior, severity, and containment. This map shows the perimeter of the Apple Fire overlaying the Living Atlas Terrain: Slope in Degrees layer.
You can explore other analysis tools and Living Atlas layers to learn more about fires as well as other types of incidents such as earthquakes.
For more information, see the following:
- Use the Analysis Tools
- Enrich Layer
- ArcGIS Living Atlas of the World Website
- Living Atlas Wildfire and Fire Content
